Return to the World Birthday Study, zodiac sign results or life path results.
Sources, years and credits
The original source files were retrieved on 20 October 2026. The Canada chart was retrieved on 27 October 2026. The added country files were retrieved on 27 October 2026. NinePath processed the data and made the charts. The offices did not produce or endorse these comparisons. We use national statistics and the open datasets listed below. The US archive is a republication of agency data, rather than a direct agency download.
| Source and coverage | Birth years or edition | Licence | Required credit |
|---|---|---|---|
| Netherlands | 1995–2025 | CC BY 4.0 | Source: CBS (Statistics Netherlands), StatLine table 70703ned |
| Metropolitan France | 1968–2025 | Licence Ouverte 2.0 | Source : Insee, statistiques de l’état civil (T79JNAIS, Les naissances en 2025 et en séries longues, mise à jour du 06/07/2026) |
| England and Wales | 1995–2025 | OGL v3.0 | Source: Office for National Statistics licensed under the Open Government Licence v3.0 |
| Denmark | 2007–2025 | CC BY 4.0 equivalent | Source: Statistics Denmark. Own calculations based on data from Statistics Denmark, StatBank.dk/foddag |
| United States (SSA) | 2000–2014 | CC BY 4.0; underlying federal data public domain | Source: FiveThirtyEight (CC BY 4.0), from CDC/NCHS (1994–2003) and Social Security Administration (2000–2014) data |
| Mexico | 1998–2021 | Términos de Libre Uso de la Información del INEGI | Fuente: INEGI, Estadística de Nacimientos Registrados. Processed by NinePath |
| Japan | 1996–2025 | Government Standard Terms of Use 2.0, CC BY 4.0 compatible | 出典:「人口動態調査」(厚生労働省)を加工して作成. Source: Vital Statistics of Japan (Ministry of Health, Labour and Welfare), via e-Stat. Processed by NinePath |
| Australia | 2007–2016 | CC BY 4.0 | Source: ABS. Source: Australian Bureau of Statistics, Births, Australia, 2016 (cat. 3301.0), media release 13 December 2017, CC BY 4.0. © Commonwealth of Australia. Accessed 20 October 2026 |
| Ireland | CSO VSD35 Year 2023 edition; average from 1980; end year not explicit | CC BY 4.0 | Source: CSO Ireland, VSD35 Birth Dates from 1980, CC BY 4.0. Processed by NinePath |
| Canada | 1995–2025, live births in Canada | Statistics Canada Open Licence | Adapted from Statistics Canada, How common is your birthday?, 1995–2025. This does not constitute an endorsement by Statistics Canada of this product. |
| Germany | 2014–2024 | Destatis general publication reuse terms | Source: Statistischer Bericht - Geburten 2025, table 12612-20, Statistisches Bundesamt (Destatis), 2026; own calculations. |
| Belgium | 1992–2025 | CC BY 4.0 | Source: Statbel. Processed by NinePath. |
| Malaysia | 1990–2022 | CC BY 4.0 | Source: data.gov.my / National Registration Department (JPN), CC BY 4.0. Processed by NinePath. |
| Slovenia | 2000–2025 | CC BY 4.0 | Source: SURS. Processed by NinePath. |
| New Zealand | 1980–2023 registrations | CC BY 4.0 | This work is based on/includes Stats NZ’s data which are licensed by Stats NZ for reuse under the Creative Commons Attribution 4.0 International licence. |
| UNdata countries and areas | 2015–2024, available complete years per area | UNdata copying with attribution; commercial use not explicit | Source: UNdata (United Nations Statistics Division) |
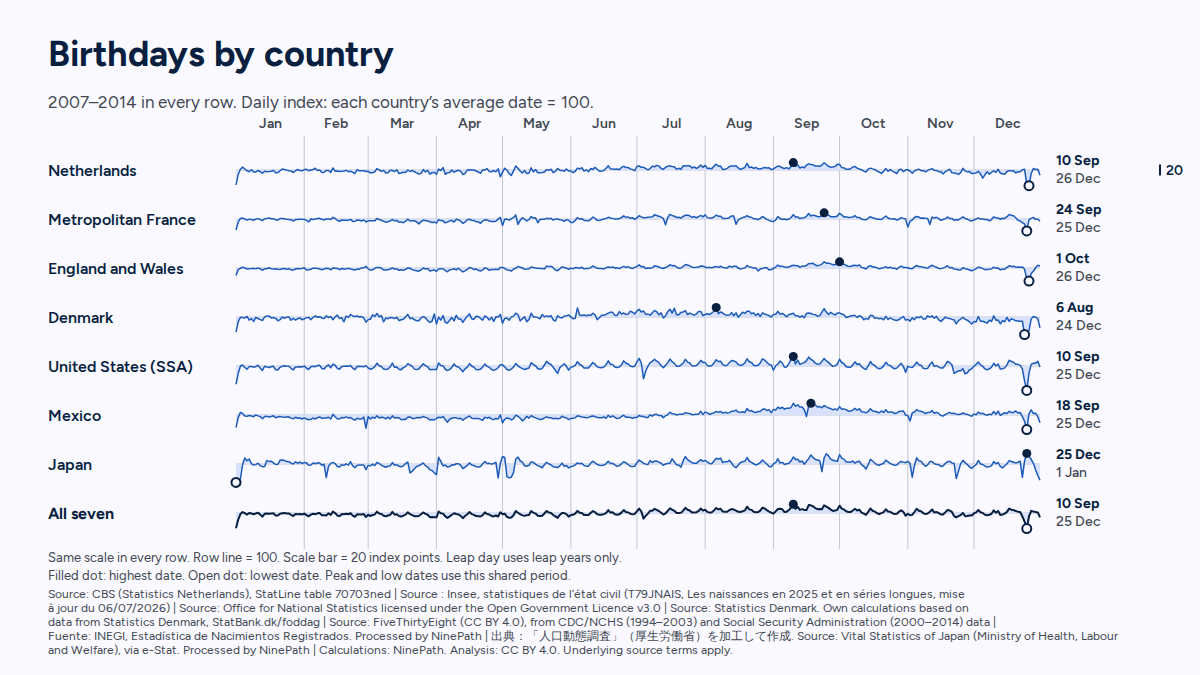
What each source counts
The Netherlands and Denmark count births to their registered populations. The Netherlands series excludes undated late reports. England and Wales use ONS data as published, including its treatment of late registrations. The Japan series covers Japanese nationals born in Japan. Mexico uses births occurring in Mexico, rebuilt by birth year from registration files. These definitions differ.
Mexico uses birth years 1998–2021. Later birth years are excluded because late registration leaves them less complete. Records without a birth day in 2013 are dropped. Mexico’s leap-day pattern is an observation only. No cause is assigned.
Metropolitan France provides consistent geographic coverage. We do not combine it with the later whole-country series. The supplementary whole-France series starts in 1998 and adds Mayotte in 2014; it is not used for a public ranking in this release.
The SSA series has different annual totals from CDC natality statistics. Its original extract definition is not fully documented in the archive. It describes that series and period. It is not the birthday distribution of the current US population.
Shared years and pooling
Cross-country comparisons use 2007–2014, the common window for the original seven selected countries. The pool adds raw counts. Each country remains visible on its own. Birth counts give larger source populations more weight. The selected countries are not a representative world sample.
Australia, Canada, Ireland and New Zealand stay outside the pool. Their sources provide day-of-year ranks or averages rather than yearly counts. The added count sources are reported separately and do not change the original pool. Belgium also retains its UNdata monthly row in the worldwide comparison. No continent-level birthday or life path ranking is claimed.
Ranking birthdays and months
For each calendar date, average births per occurrence equals total births on that date divided by its occurrences in the covered years. 29 February uses leap-year occurrences only. The rarest regular birthday excludes leap day. Exact ties follow calendar order in the displayed top and bottom lists.
Monthly share equals that month’s births divided by all births. Monthly births per day divide by the actual number of calendar days, including leap days. The headline uses the per-day rate.
Australia keeps the published ABS ranks of ten-year totals, including ties. Its last-place rank for 29 February is not adjusted for occurrences. Ireland keeps the CSO’s rounded published average per date from its Year 2023 edition. Its leap-day average is across all years. We do not turn that into a per-occurrence average.
Canada: source ranks and checks
The Canada source is Statistics Canada's official birthday chart, published through its social accounts. The period label is 1995–2025, live births in Canada. The chart cites the Canadian Vital Statistics – Birth database. Its ranks and tie markers were transcribed independently from the image and compared cell by cell. They agree. This checks the published ranks, not the underlying birth counts.
The chart does not provide counts or state an explicit aggregation formula. We retain its leap-day rank without an occurrence correction and exclude leap day from the mean-rank sign summary. That summary uses America/Toronto as a representative Eastern-zone approximation, with historical local civil days and ephemeris ingress splitting. It supplies no sign shares or birth rates. Canada stays outside the pooled count comparison and has no life path results.
The Statistics Canada Open Licence permits commercial reuse and value-added products. The agency's social copyright terms point to the same ownership-and-usage rules. We extract the data into our own graphic and do not reproduce the official artwork or logos. The source-rank download uses the licence's source notice; our custom charts and calculations use its adapted notice. Open Licence, social-media terms.
Adapted from Statistics Canada, How common is your birthday?, 1995–2025. This does not constitute an endorsement by Statistics Canada of this product. Original chart.
Ireland’s reference period
The official CSO JSON-stat and PX exports call the table “Birth Dates from 1980” and show Year labels “2015” and “2023”. The PX fields for reference period and base period are blank. Neither the table nor its linked background notes explicitly confirms the last birth year in either average. We therefore publish the edition label, not an inferred full date range. Period-dependent sign estimates remain withheld.
Tropical Sun signs and ingress days
The Sun’s apparent geocentric ecliptic longitude, referred to the true equinox of date, supplies the tropical sign. The ephemeris uses Astronomy Engine. Its ingress search locates each sign change. Each sign spans 30 degrees. Sign length drives raw share, so the comparison uses births per sign day as its headline.
For a day when the Sun changes sign, we split births before and after the ingress in local civil time. This respects historical daylight-saving changes and the actual day length. Except in Japan, the time-share split assumes births are spread evenly through that day. This is an estimate of a population allocation, not an individual birth-chart assignment.
| Source | Local time zone |
|---|---|
| Netherlands | Europe/Amsterdam |
| Metropolitan France | Europe/Paris |
| England and Wales | Europe/London |
| Denmark | Europe/Copenhagen |
| United States (SSA) | America/Chicago |
| Mexico | America/Mexico_City |
| Japan | Asia/Tokyo |
| Australia | Australia/Sydney |
The US uses America/Chicago and Mexico uses America/Mexico_City as representative zones. Both countries span multiple time zones. Their ingress-day splits therefore approximate births outside the selected zone. Australia’s rank summary uses Australia/Sydney and does not estimate population sign shares.
Japan uses recorded birth hours on ingress days. The hour containing the ingress is split by elapsed time, assuming births are spread evenly within that hour. Unknown-hour births are allocated in the same proportion as known-hour births on that day.
The pooled sign denominator is the mean sign duration across the included countries, so the pooled numerator still uses raw combined births. A rate index of 100 means the country or pool’s average daily birth rate. Charts plot the per-day index.
Read how NinePath reads your sky for the app’s chart method.
Life path method
To find your life path number, add all eight digits of your birth date, then add the digits of the total until one digit is left. If a step lands on 11, 22 or 33, NinePath keeps it as a master number. The study uses numerology_v1. Master-number rows are exclusive, so each birth is counted once. Calendar-date shares are enumerated over the same years as the birth shares.
No date from 2000 to 2025 produces life path 33 under this rule. This is a calendar result with a stated range, not a statement about every possible birth year. Read how NinePath calculates your numbers.
Worldwide peak months
The main UNdata window is 2015–2024. An area needs at least five complete years. Each accepted country-year must contain all months in one source-year, reliability and record-type series. Selection prefers year of occurrence, then registration, then census; final figures, then provisional figures, then other estimates; and finally the latest source year. Nonconsecutive years are allowed. Rates divide summed births by the real month lengths in the selected years.
The blind recount used 2015–2025 and a different source-selection rule. Peak names agreed for 106 of 110 common areas. We omit Cayman Islands, Finland, Oman and Serbia. Agreement across different rules supports the remaining peak names, but does not verify their exact rates. The public table and CSV therefore publish peak names and main-count coverage, without exact world rates, counts or lowest-month claims.
Areas with fewer than 10,000 births are marked small sample. This is a size warning, not a confidence interval. The table includes countries and territories. UNdata contains occurrence, registration and census series, which are labelled in the download. It cannot establish a world birthday winner.
Two-count verification
The first implementation uses Astronomy Engine and a port checked against the app’s compiled number calculation. The blind recount was written separately without reading the first implementation. It uses its own digit-sum calculation and a Meeus solar formula.
Daily counts, month counts and life path counts match in the full-study countries and common-period pool. Sign shares differ by less than 0.0005 percentage points. Published sign figures use only rounding that both calculations support. Allocated sign birth counts and precise ingress-derived durations are not offered as exact observed counts.
Supplementary checks independently re-extract ABS ranks with an HTML parser and CSO averages from the original CSV. They recompute Australia’s mean sign ranks from the recount’s solar ingresses. Those checks were implemented after reading the first analysis, so they are separate code paths rather than another blind recount. Irish sign estimates remain excluded.
NinePath’s engineering lead confirmed that the number method matches the app and that sign ingress splitting uses the ephemeris and local civil time. The public figures trace to checked result rows.
Download and reuse
Download the verified data table and keep its reuse notice. NinePath’s original analysis, charts and added table structure are licensed CC BY 4.0. Credit NinePath’s World Birthday Study, link to this method page, name the source shown on each row and state your changes. Underlying source material retains its own terms.
Source credits are in the table above and on every download row. Source: UNdata (United Nations Statistics Division). UNdata permits copying with attribution; it does not explicitly address commercial reuse. Our licence covers NinePath’s contribution and does not expand the rights granted by UNdata or the national offices.
Limits
The study data are birth records over stated periods. They do not measure everyone alive today. Country coverage differs. Registration delays, missing birth days and rounding can affect results. A low birth count does not explain its own cause. This study makes no inference about an individual from the frequency of their birthday, sign or number.
Detailed birthday tables
The detailed birthday tables accompany the country answers and heat maps. The country periods and source measures remain separate.
Netherlands birthday detail
In the Netherlands, the most common birthday in 1995–2025 was 24 September, averaging 549.03 births per occurrence. The rarest regular birthday was 26 December, with 356.06 births.
The bottom list starts with the lowest rate. Equal values follow calendar order.
| Most common dates | Average births per occurrence | Least common dates | Average births per occurrence |
|---|---|---|---|
| 24 September | 549.03 | 26 December | 356.06 |
| 12 September | 544.19 | 1 January | 359.65 |
| 20 September | 543.48 | 25 December | 369.52 |
| 29 September | 540.71 | 5 December | 427.94 |
| 30 September | 540.55 | 31 December | 435.00 |
| 25 September | 540.06 | 5 May | 452.55 |
| 26 September | 540.03 | 2 January | 456.68 |
| 19 September | 539.35 | 27 December | 458.48 |
| 23 September | 539.06 | 1 April | 458.52 |
| 18 September | 538.55 | 6 December | 459.39 |
Source: CBS (Statistics Netherlands), StatLine table 70703ned. Calculations by NinePath. Source table.
Metropolitan France birthday detail
In Metropolitan France, the most common birthday in 1968–2025 was 7 May, averaging 2,223.17 births per occurrence. The rarest regular birthday was 25 December, with 1,605.88 births.
The bottom list starts with the lowest rate. Equal values follow calendar order.
| Most common dates | Average births per occurrence | Least common dates | Average births per occurrence |
|---|---|---|---|
| 7 May | 2,223.17 | 25 December | 1,605.88 |
| 12 July | 2,222.48 | 1 January | 1,635.98 |
| 10 May | 2,220.72 | 1 November | 1,752.07 |
| 6 May | 2,219.19 | 11 November | 1,824.29 |
| 5 May | 2,207.14 | 24 December | 1,840.31 |
| 10 July | 2,206.26 | 15 August | 1,858.21 |
| 11 May | 2,203.50 | 31 December | 1,898.12 |
| 3 May | 2,203.48 | 1 May | 1,914.79 |
| 17 July | 2,203.19 | 2 January | 1,916.24 |
| 4 May | 2,202.59 | 14 July | 1,916.38 |
Source : Insee, statistiques de l’état civil (T79JNAIS, Les naissances en 2025 et en séries longues, mise à jour du 06/07/2026). Calculations by NinePath. Source table.
England and Wales birthday detail
In England and Wales, the most common birthday in 1995–2025 was 26 September, averaging 1,927.32 births per occurrence. The rarest regular birthday was 26 December, with 1,293.97 births.
The bottom list starts with the lowest rate. Equal values follow calendar order.
| Most common dates | Average births per occurrence | Least common dates | Average births per occurrence |
|---|---|---|---|
| 26 September | 1,927.32 | 26 December | 1,293.97 |
| 25 September | 1,925.87 | 25 December | 1,360.10 |
| 27 September | 1,920.42 | 1 January | 1,526.10 |
| 23 September | 1,920.29 | 27 December | 1,615.81 |
| 30 September | 1,916.94 | 24 December | 1,667.97 |
| 19 September | 1,911.39 | 1 April | 1,686.03 |
| 22 September | 1,909.32 | 28 December | 1,686.74 |
| 24 September | 1,907.03 | 2 January | 1,688.16 |
| 18 September | 1,905.39 | 13 April | 1,701.19 |
| 29 September | 1,902.65 | 30 November | 1,706.45 |
Source: Office for National Statistics licensed under the Open Government Licence v3.0. Calculations by NinePath. Source table.
Denmark birthday detail
In Denmark, the most common birthday in 2007–2025 was 18 August, averaging 184.47 births per occurrence. The rarest regular birthday was 24 December, with 110.21 births.
The bottom list starts with the lowest rate. Equal values follow calendar order.
| Most common dates | Average births per occurrence | Least common dates | Average births per occurrence |
|---|---|---|---|
| 18 August | 184.47 | 24 December | 110.21 |
| 18 July | 183.79 | 25 December | 114.89 |
| 15 July | 183.21 | 1 January | 120.47 |
| 16 July | 183.16 | 26 December | 121.74 |
| 6 August | 182.26 | 31 December | 131.26 |
| 22 July | 181.89 | 23 December | 146.05 |
| 24 September | 181.74 | 1 May | 147.58 |
| 6 July | 181.26 | 5 December | 148.26 |
| 20 July | 181.21 | 30 November | 148.95 |
| 5 August | 181.16 | 6 April | 149.16 |
Source: Statistics Denmark. Own calculations based on data from Statistics Denmark, StatBank.dk/foddag. Calculations by NinePath. Source table.
United States (SSA) birthday detail
In the United States (SSA data), the most common birthday in 2000–2014 was 12 September, averaging 12,734.93 births per occurrence. The rarest regular birthday was 25 December, with 6,437.87 births.
The bottom list starts with the lowest rate. Equal values follow calendar order.
| Most common dates | Average births per occurrence | Least common dates | Average births per occurrence |
|---|---|---|---|
| 12 September | 12,734.93 | 25 December | 6,437.87 |
| 19 September | 12,695.67 | 1 January | 7,735.33 |
| 20 September | 12,541.53 | 24 December | 8,034.40 |
| 19 December | 12,445.67 | 4 July | 8,815.27 |
| 10 September | 12,444.53 | 2 January | 9,605.53 |
| 20 December | 12,439.53 | 26 December | 9,874.20 |
| 18 September | 12,425.80 | 23 November | 9,875.40 |
| 8 August | 12,421.87 | 25 November | 9,978.47 |
| 26 September | 12,421.47 | 27 November | 10,012.67 |
| 17 September | 12,386.13 | 24 November | 10,024.60 |
Source: FiveThirtyEight (CC BY 4.0), from CDC/NCHS (1994–2003) and Social Security Administration (2000–2014) data. Calculations by NinePath. Source table.
Mexico birthday detail
In Mexico, the most common birthday in 1998–2021 was 30 August, averaging 7,418.71 births per occurrence. The rarest regular birthday was 25 December, with 4,598.04 births.
The bottom list starts with the lowest rate. Equal values follow calendar order.
| Most common dates | Average births per occurrence | Least common dates | Average births per occurrence |
|---|---|---|---|
| 30 August | 7,418.71 | 25 December | 4,598.04 |
| 18 September | 7,412.08 | 1 January | 4,961.04 |
| 20 September | 7,392.71 | 31 December | 5,243.58 |
| 1 September | 7,339.33 | 1 May | 5,437.25 |
| 14 September | 7,299.79 | 24 December | 5,455.21 |
| 10 September | 7,297.71 | 31 March | 5,654.17 |
| 19 September | 7,263.12 | 2 November | 5,689.50 |
| 21 September | 7,240.83 | 10 May | 5,698.00 |
| 12 September | 7,221.92 | 29 March | 5,701.17 |
| 22 September | 7,167.79 | 31 May | 5,718.67 |
Fuente: INEGI, Estadística de Nacimientos Registrados. Processed by NinePath. Calculations by NinePath. Source table.
Japan birthday detail
In Japan, the most common birthday in 1996–2025 was 25 September, averaging 3,189.03 births per occurrence. The rarest regular birthday was 1 January, with 1,877.43 births.
The bottom list starts with the lowest rate. Equal values follow calendar order.
| Most common dates | Average births per occurrence | Least common dates | Average births per occurrence |
|---|---|---|---|
| 25 September | 3,189.03 | 1 January | 1,877.43 |
| 25 December | 3,164.40 | 2 January | 1,899.53 |
| 26 September | 3,134.47 | 31 December | 1,977.43 |
| 2 May | 3,132.87 | 3 January | 2,025.30 |
| 1 May | 3,132.03 | 23 November | 2,051.47 |
| 5 January | 3,091.70 | 11 February | 2,106.67 |
| 8 August | 3,080.70 | 3 November | 2,117.97 |
| 18 September | 3,079.90 | 4 May | 2,121.83 |
| 8 May | 3,077.77 | 29 April | 2,125.93 |
| 26 December | 3,064.97 | 5 May | 2,151.97 |
出典:「人口動態調査」(厚生労働省)を加工して作成. Source: Vital Statistics of Japan (Ministry of Health, Labour and Welfare), via e-Stat. Processed by NinePath. Calculations by NinePath. Source table.
Canada birthday detail
20 September leads Statistics Canada's published ranking for 1995–2025, live births in Canada. 25 December is the rarest regular date. This source supplies ranks, including ties. It does not supply birth counts or per-occurrence rates.
| Most common dates | Statistics Canada rank | Least common regular dates | Statistics Canada rank |
|---|---|---|---|
| 20 September | 1 | 25 December | 365 |
| 18 September | 2 | 26 December | 364 |
| 25 September | 3 | 24 December | 363 |
| 16 September | 4 | 1 January | 362 |
| 19 September | 5 | 2 January | 361 |
| 26 September | 6 | 27 December | 360 |
| 12 September | 7 | 31 December | 359 |
| 24 September | 8 | 11 November | 358 |
| 5 July | 9 | 23 December | 357 |
| 22 September | 10 | 9 December | 356 |
Adapted from Statistics Canada, How common is your birthday?, 1995–2025. This does not constitute an endorsement by Statistics Canada of this product. Original chart.
Australia birthday detail
17 September leads the ABS ranking for 2007–2016. 25 December is the rarest regular birthday. ABS ranks totals across the period. It does not provide complete daily counts, so this section cannot use the per-occurrence ranking applied above.
| Most common dates | ABS rank | Least common regular dates | ABS rank |
|---|---|---|---|
| 17 September | 1 | 25 December | 365 |
| 8 April | 2 | 26 December | 364 |
| 23 September | 3 | 1 January | 363 |
| 24 September | 4 | 26 January | 362 |
| 1 October | 4 | 25 April | 361 |
| 12 February | 6 | 27 December | 360 |
| 29 April | 7 | 28 December | 359 |
| 4 March | 8 | 24 December | 358 |
| 16 April | 9 | 13 December | 357 |
| 5 March | 10 | 29 November | 356 |
Source: ABS. Source: Australian Bureau of Statistics, Births, Australia, 2016 (cat. 3301.0), media release 13 December 2017, CC BY 4.0. © Commonwealth of Australia. Accessed 20 October 2026. Calculations by NinePath.
Ireland birthday detail
In the CSO VSD35 Year 2023 edition, “Average Birth Dates from 1980”, 22 September, 27 September, 1 October share the highest published average: 186 births. 26 December has the lowest average among regular dates. The published averages are rounded, so the leading dates tie here.
| Dates with highest averages | Published average births | Dates with lowest regular averages | Published average births |
|---|---|---|---|
| 22 September | 186 | 26 December | 107 |
| 27 September | 186 | 25 December | 108 |
| 1 October | 186 | 24 December | 128 |
| 23 September | 185 | 17 March | 138 |
| 26 September | 185 | 1 January | 142 |
| 29 September | 185 | 27 December | 149 |
| 20 September | 184 | 31 October | 151 |
| 21 September | 184 | 23 December | 151 |
| 25 September | 184 | 30 October | 152 |
| 24 September | 183 | 2 January | 157 |
Source: CSO Ireland, VSD35 Birth Dates from 1980, CC BY 4.0. Processed by NinePath
Pooled birthday detail
The pooled view covers 2007–2014 in the original seven selected countries. It adds raw counts, then divides by shared calendar occurrences. It does not average country percentages. The US and Mexico contribute most of the records, so the result is not a world estimate.
The bottom list starts with the lowest rate. Equal values follow calendar order.
| Most common dates | Average births per occurrence | Least common regular dates | Average births per occurrence |
|---|---|---|---|
| 10 September | 29,291.00 | 25 December | 18,289.50 |
| 17 September | 28,930.00 | 1 January | 18,404.25 |
| 24 September | 28,802.88 | 24 December | 21,439.50 |
| 18 September | 28,796.62 | 2 January | 22,361.38 |
| 1 October | 28,634.75 | 4 July | 22,777.38 |
| 19 September | 28,326.50 | 13 April | 22,995.50 |
| 25 September | 28,219.12 | 6 April | 23,118.00 |
| 20 August | 28,176.75 | 26 May | 23,142.62 |
| 12 September | 28,132.88 | 4 May | 23,193.50 |
| 9 September | 27,868.38 | 5 May | 23,318.00 |
Pooled birth months
The pooled view covers 2007–2014 in the original seven selected countries. It adds raw counts, then divides by shared calendar occurrences. It does not average country percentages. The US and Mexico contribute most of the records, so the result is not a world estimate.
| Month | Births | Share of births (%) | Births per day |
|---|---|---|---|
| January | 6,100,879 | 8.24 | 24,600.32 |
| February | 5,577,231 | 7.53 | 24,678.01 |
| March | 6,068,481 | 8.20 | 24,469.68 |
| April | 5,863,290 | 7.92 | 24,430.38 |
| May | 6,112,266 | 8.26 | 24,646.23 |
| June | 6,045,908 | 8.17 | 25,191.28 |
| July | 6,455,060 | 8.72 | 26,028.47 |
| August | 6,560,715 | 8.86 | 26,454.50 |
| September | 6,531,173 | 8.82 | 27,213.22 |
| October | 6,445,662 | 8.71 | 25,990.57 |
| November | 6,041,485 | 8.16 | 25,172.85 |
| December | 6,224,500 | 8.41 | 25,098.79 |
Peak birth months by country and area
We publish the peak-month names that agreed for 106 countries and areas in two counts. The main window is 2015–2024, using at least five complete years per area. Each peak uses births per day, so longer months do not get an automatic advantage. The table includes territories as well as countries.
| Country or area | Peak month per day | Years used in the main count | Series basis | Small sample |
|---|---|---|---|---|
| Albania | September | 2016-2023 | year of occurrence | No |
| American Samoa | March | 2015-2024 | year of occurrence | Yes |
| Anguilla | October | 2015-2024 | year of registration | Yes |
| Antigua and Barbuda | November | 2015-2019 | year of registration | Yes |
| Argentina | March | 2017;2018;2019;2020;2022;2023 | year of occurrence | No |
| Armenia | September | 2016;2017;2018;2020;2023 | year of occurrence | No |
| Aruba | September | 2015-2024 | year of occurrence | No |
| Australia | March | 2015-2024 | year of occurrence | No |
| Austria | September | 2015;2016;2017;2018;2019;2021;2022;2023 | year of occurrence | No |
| Azerbaijan | February | 2016-2021 | year of registration | No |
| Bahrain | October | 2015;2016;2017;2018;2019;2021;2022 | year of occurrence | No |
| Belgium | July | 2015;2016;2017;2018;2021;2022;2023 | year of occurrence | No |
| Bermuda | August | 2015-2023 | year of occurrence | Yes |
| Brazil | April | 2015;2016;2017;2018;2020;2021;2022;2024 | year of occurrence|year of registration | No |
| Brunei Darussalam | November | 2015-2024 | year of registration | No |
| Bulgaria | July | 2015-2023 | year of occurrence | No |
| Canada | September | 2015-2024 | year of occurrence | No |
| Chile | January | 2015-2021 | year of occurrence | No |
| China, Hong Kong SAR | September | 2015-2024 | year of occurrence | No |
| China, Macao SAR | September | 2015;2019;2020;2021;2022 | year of occurrence | No |
| Colombia | September | 2020-2024 | year of occurrence | No |
| Costa Rica | September | 2015-2024 | year of occurrence | No |
| Croatia | September | 2015-2023 | year of occurrence | No |
| Cuba | September | 2015-2023 | year of occurrence | No |
| Curaçao | January | 2015-2019 | year of occurrence | Yes |
| Cyprus | September | 2015-2023 | year of occurrence | No |
| Czechia | July | 2015-2023 | year of occurrence | No |
| Denmark | August | 2015-2023 | year of occurrence | No |
| Egypt | July | 2015-2022 | year of occurrence|year of registration | No |
| Estonia | July | 2015;2016;2017;2018;2019;2021;2022;2023 | year of occurrence | No |
| Faroe Islands | July | 2015-2024 | year of occurrence | Yes |
| French Guiana | November | 2020-2024 | year of occurrence | No |
| French Polynesia | April | 2017-2024 | year of occurrence | No |
| Georgia | August | 2016-2023 | year of occurrence | No |
| Germany | September | 2015-2024 | year of occurrence | No |
| Greece | September | 2015-2024 | year of occurrence | No |
| Greenland | August | 2015-2019 | year of occurrence | Yes |
| Guadeloupe | October | 2018;2020;2021;2022;2023;2024 | year of occurrence | No |
| Guam | September | 2015;2016;2017;2018;2023;2024 | year of occurrence | No |
| Guatemala | September | 2015;2016;2017;2018;2019;2020;2021;2023;2024 | year of occurrence | No |
| Guernsey | May | 2019-2023 | year of occurrence | Yes |
| Hungary | September | 2015-2024 | year of occurrence | No |
| Iceland | September | 2015-2024 | year of occurrence | No |
| Ireland | September | 2015-2024 | year of registration | No |
| Isle of Man | October | 2016-2024 | year of registration | Yes |
| Israel | September | 2015-2024 | year of occurrence | No |
| Italy | September | 2015-2023 | year of occurrence | No |
| Japan | September | 2015-2024 | year of occurrence | No |
| Jersey | July | 2020-2024 | year of registration | Yes |
| Kazakhstan | September | 2015-2023 | year of occurrence | No |
| Kuwait | October | 2015-2023 | year of occurrence | No |
| Kyrgyzstan | August | 2015-2024 | year of occurrence | No |
| Latvia | July | 2015-2023 | year of occurrence | No |
| Liechtenstein | July | 2015-2023 | year of occurrence | Yes |
| Lithuania | July | 2015-2024 | year of occurrence | No |
| Luxembourg | July | 2015-2023 | year of occurrence | No |
| Malaysia | September | 2015-2023 | year of occurrence | No |
| Maldives | May | 2015;2016;2017;2018;2019;2021 | year of occurrence | No |
| Malta | November | 2015-2023 | year of occurrence | No |
| Martinique | November | 2020-2024 | year of occurrence | No |
| Mauritius | April | 2015-2024 | year of registration | No |
| Mayotte | April | 2018;2020;2021;2022;2023;2024 | year of occurrence | No |
| Mexico | September | 2015-2023 | year of occurrence | No |
| Mongolia | July | 2015-2024 | year of registration | No |
| Montenegro | July | 2015-2023 | year of occurrence | No |
| Montserrat | October | 2015;2016;2018;2019;2020;2021;2022 | year of occurrence | Yes |
| Netherlands (Kingdom of the) | September | 2015-2024 | year of occurrence | No |
| New Caledonia | March | 2015-2022 | year of occurrence | No |
| New Zealand | November | 2015;2016;2017;2018;2019;2020;2023;2024 | year of registration | No |
| North Macedonia | July | 2015-2024 | year of occurrence | No |
| Norway | July | 2015-2024 | year of occurrence | No |
| Palau | January | 2015-2023 | year of occurrence | Yes |
| Panama | September | 2015-2024 | year of occurrence | No |
| Poland | September | 2015;2016;2017;2018;2019;2021;2022;2023;2024 | year of occurrence | No |
| Portugal | September | 2015-2024 | year of occurrence | No |
| Puerto Rico | September | 2015-2024 | year of occurrence | No |
| Qatar | October | 2015-2023 | year of occurrence | No |
| Republic of Korea | January | 2015-2024 | year of occurrence | No |
| Republic of Moldova | September | 2016;2018;2019;2020;2022;2023 | year of occurrence | No |
| Reunion | April | 2018;2020;2021;2022;2023;2024 | year of occurrence | No |
| Romania | September | 2015-2023 | year of occurrence | No |
| Saint Barthélemy | March | 2018-2024 | year of occurrence | Yes |
| Saint Helena ex. dep. | August | 2016-2023 | year of occurrence | Yes |
| Saint Pierre and Miquelon | September | 2018-2024 | year of occurrence | Yes |
| Saint Vincent and the Grenadines | November | 2015-2021 | year of occurrence | No |
| Saint-Martin (French part) | December | 2018-2024 | year of occurrence | Yes |
| Seychelles | May | 2015-2024 | year of registration | No |
| Singapore | September | 2015-2024 | year of occurrence | No |
| Slovakia | September | 2015-2024 | year of occurrence | No |
| Slovenia | July | 2015-2023 | year of occurrence | No |
| South Africa | March | 2016-2024 | year of occurrence | No |
| Spain | September | 2015-2024 | year of occurrence | No |
| Sri Lanka | June | 2015;2020;2021;2022;2023 | year of registration | No |
| Suriname | September | 2015-2024 | year of occurrence | No |
| Sweden | May | 2015-2023 | year of occurrence | No |
| Switzerland | September | 2015-2023 | year of occurrence | No |
| Thailand | September | 2015-2024 | year of registration | No |
| Turks and Caicos Islands | September | 2015-2024 | year of occurrence | Yes |
| Türkiye | July | 2016-2023 | year of occurrence | No |
| Ukraine | July | 2016-2021 | year of registration | No |
| United Arab Emirates | October | 2018-2024 | year of registration | No |
| United Kingdom of Great Britain and Northern Ireland | September | 2015-2024 | year of occurrence | No |
| United States of America | August | 2015-2019 | year of occurrence | No |
| Uruguay | March | 2015-2023 | year of occurrence | No |
| Uzbekistan | September | 2015-2024 | year of registration | No |
| Åland Islands | September | 2015-2024 | year of occurrence | Yes |
Source: UNdata (United Nations Statistics Division). Calculations by NinePath.
Additional country results
The following countries extend the study with their own source periods. The original selected-country pool is unchanged.
Germany addition
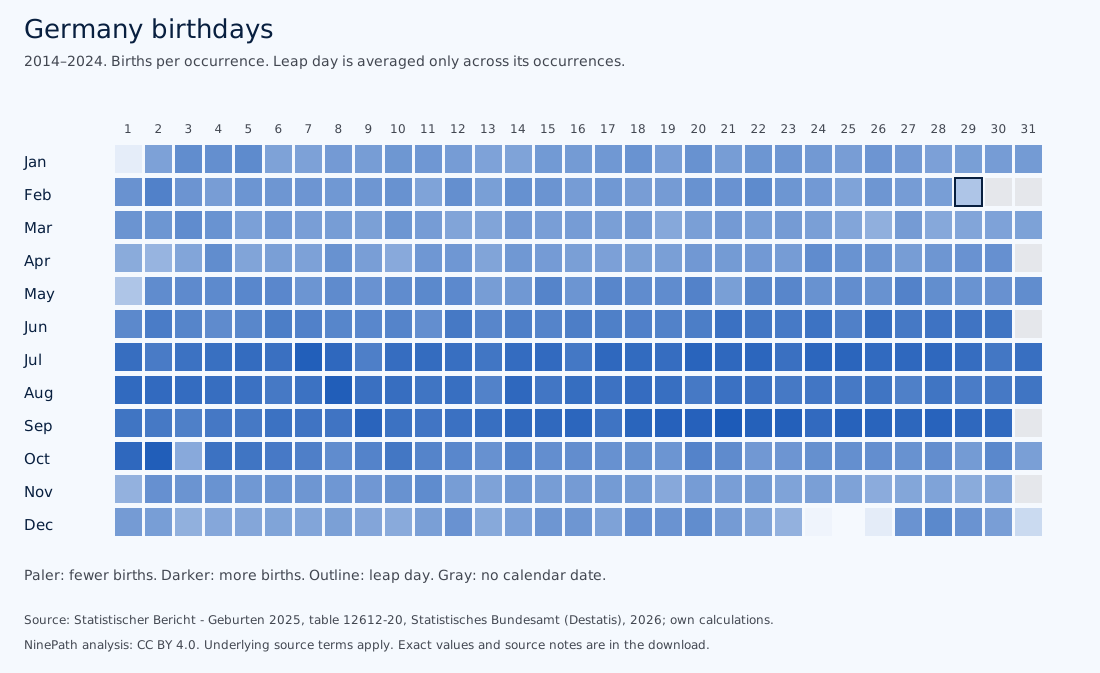
In Germany, the most common birthday in 2014–2024 was 21 September, averaging 2,337.00 births per occurrence. The rarest regular birthday was 25 December, at 1,444.27.
Reporting-year data for mothers resident in Germany, including qualifying births abroad. The altered 2025 counts are excluded. The 2016 footnote gives a separate all-sex total including unspecified-sex cases; we keep the displayed daily table.
Swipe to see the whole chart
Leap day averaged 1,736.67 births across 3 occurrences. September had the highest birth-month rate at 2,242.82 births per day; December had the lowest at 1,901.96.
| Most common regular dates | Births per occurrence | Least common regular dates | Births per occurrence |
|---|---|---|---|
| 21 September | 2,337.00 | 25 December | 1,444.27 |
| 8 August | 2,320.82 | 24 December | 1,470.64 |
| 2 October | 2,318.55 | 1 January | 1,511.27 |
| 7 July | 2,315.00 | 26 December | 1,515.73 |
| 23 September | 2,309.18 | 31 December | 1,622.00 |
| 22 September | 2,305.64 | 1 May | 1,737.27 |
| 19 September | 2,301.73 | 2 April | 1,832.82 |
| 20 September | 2,301.73 | 23 December | 1,848.73 |
| 25 September | 2,294.64 | 1 November | 1,850.18 |
| 28 September | 2,290.45 | 3 December | 1,858.91 |
Sign allocation uses Europe/Berlin with historical local civil days and the stated within-day time-share assumption. Raw shares reflect sign length; the headline comparison uses births per sign day.
| Sign | Birth share (%) | Births per sign day | Per-day index |
|---|---|---|---|
| Aries | 7.89 | 1946.1 | 94.52 |
| Taurus | 8.35 | 2028.18 | 98.51 |
| Gemini | 8.71 | 2091.03 | 101.56 |
| Cancer | 9.27 | 2217.3 | 107.69 |
| Leo | 9.26 | 2225.9 | 108.11 |
| Virgo | 9.10 | 2213.45 | 107.51 |
| Libra | 8.67 | 2146.1 | 104.23 |
| Scorpio | 7.92 | 1994.0 | 96.85 |
| Sagittarius | 7.65 | 1946 | 94.50 |
| Capricorn | 7.45 | 1901.8 | 92.37 |
| Aquarius | 7.85 | 1995.3 | 96.91 |
| Pisces | 7.88 | 1977.2 | 96.03 |
The exclusive life path distribution uses the same source years and NinePath’s all-digits method. The calendar-date baseline uses those years too.
| Life path | Birth share (%) | Calendar-date share (%) |
|---|---|---|
| 1 | 11.15 | 11.15 |
| 2 | 7.38 | 7.27 |
| 3 | 11.14 | 11.17 |
| 4 | 5.41 | 5.60 |
| 5 | 11.11 | 11.10 |
| 6 | 11.14 | 11.08 |
| 7 | 11.05 | 11.05 |
| 8 | 11.08 | 11.08 |
| 9 | 11.09 | 11.08 |
| 11 | 3.78 | 3.88 |
| 22 | 5.67 | 5.55 |
| 33 | 0.00 | 0.00 |
Source: Statistischer Bericht - Geburten 2025, table 12612-20, Statistisches Bundesamt (Destatis), 2026; own calculations. Source. Reuse terms.
Belgium addition
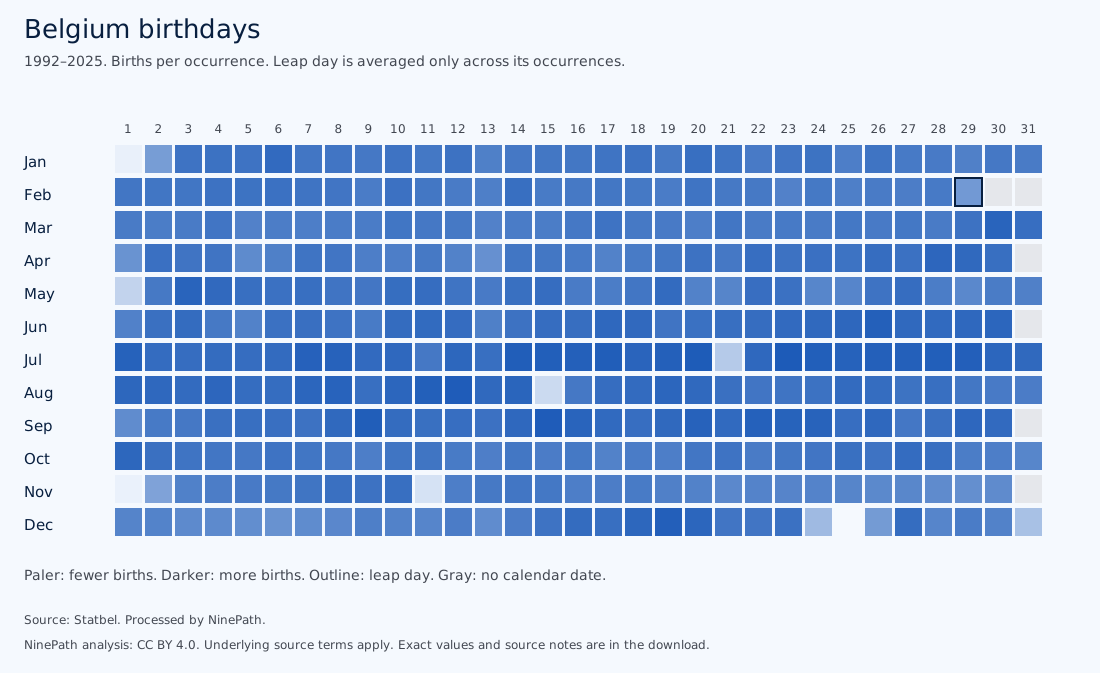
In Belgium, the most common birthday in 1992–2025 was 23 July, averaging 352.12 births per occurrence. The rarest regular birthday was 25 December, at 196.53.
The uploaded daily-birth workbook has one row per date. Its date and birth-count fields match the earlier variable metadata. That metadata’s old coverage is not used to shorten this series.
Swipe to see the whole chart
Leap day averaged 290.78 births across 9 occurrences. July had the highest birth-month rate at 339.26 births per day; November had the lowest at 308.71.
| Most common regular dates | Births per occurrence | Least common regular dates | Births per occurrence |
|---|---|---|---|
| 23 July | 352.12 | 25 December | 196.53 |
| 20 July | 351.41 | 1 November | 204.15 |
| 12 August | 350.91 | 1 January | 205.50 |
| 15 September | 350.91 | 11 November | 219.65 |
| 9 September | 349.21 | 15 August | 226.59 |
| 17 July | 349.15 | 1 May | 233.53 |
| 14 July | 349.03 | 21 July | 242.56 |
| 24 July | 348.65 | 31 December | 251.88 |
| 28 July | 348.44 | 24 December | 258.68 |
| 15 July | 348.29 | 2 November | 281.82 |
Sign allocation uses Europe/Brussels with historical local civil days and the stated within-day time-share assumption. Raw shares reflect sign length; the headline comparison uses births per sign day.
| Sign | Birth share (%) | Births per sign day | Per-day index |
|---|---|---|---|
| Aries | 8.27 | 321.57 | 99.09 |
| Taurus | 8.53 | 326.72 | 100.68 |
| Gemini | 8.62 | 326.22 | 100.53 |
| Cancer | 8.94 | 336.98 | 103.84 |
| Leo | 8.89 | 336.79 | 103.8 |
| Virgo | 8.68 | 332.9 | 102.60 |
| Libra | 8.39 | 327.20 | 100.83 |
| Scorpio | 7.90 | 313.65 | 96.65 |
| Sagittarius | 7.86 | 315.36 | 97.18 |
| Capricorn | 7.70 | 309.68 | 95.43 |
| Aquarius | 8.10 | 324.6 | 100.02 |
| Pisces | 8.10 | 320.43 | 98.74 |
The exclusive life path distribution uses the same source years and NinePath’s all-digits method. The calendar-date baseline uses those years too.
| Life path | Birth share (%) | Calendar-date share (%) |
|---|---|---|
| 1 | 11.12 | 11.13 |
| 2 | 4.91 | 4.87 |
| 3 | 11.08 | 11.12 |
| 4 | 7.52 | 7.62 |
| 5 | 11.08 | 11.10 |
| 6 | 9.21 | 9.12 |
| 7 | 11.15 | 11.10 |
| 8 | 11.06 | 11.11 |
| 9 | 11.13 | 11.12 |
| 11 | 6.20 | 6.26 |
| 22 | 3.56 | 3.48 |
| 33 | 1.97 | 1.97 |
Source: Statbel. Processed by NinePath. Source. Reuse terms.
Malaysia addition
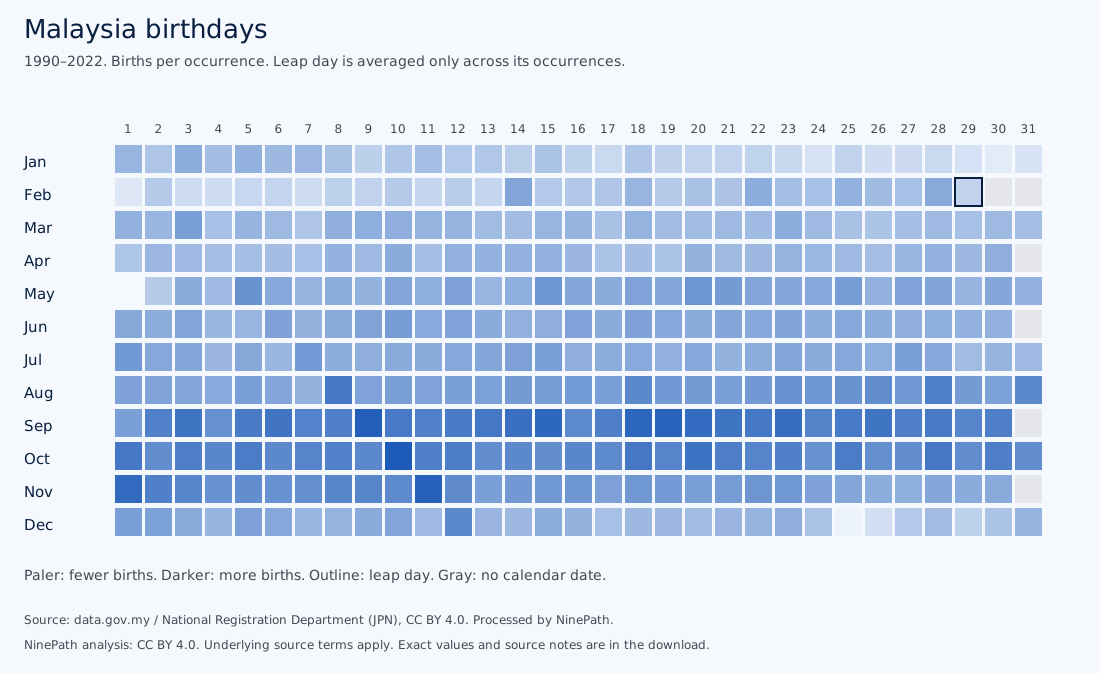
In Malaysia, the most common birthday in 1990–2022 was 10 October, averaging 1,574.79 births per occurrence. The rarest regular birthday was 1 May, at 1,281.82.
These are actual birth dates of people registered with JPN, not registration dates. We use complete years from 1990 and exclude partial 2023. Unregistered births are absent. Late registration can revise past dates.
Swipe to see the whole chart
Leap day averaged 1,351.00 births across 8 occurrences. September had the highest birth-month rate at 1,518.06 births per day; January had the lowest at 1,364.66.
| Most common regular dates | Births per occurrence | Least common regular dates | Births per occurrence |
|---|---|---|---|
| 10 October | 1,574.79 | 1 May | 1,281.82 |
| 9 September | 1,567.12 | 25 December | 1,292.64 |
| 11 November | 1,563.00 | 30 January | 1,307.88 |
| 19 September | 1,558.12 | 1 February | 1,314.91 |
| 18 September | 1,553.18 | 31 January | 1,320.97 |
| 15 September | 1,551.12 | 24 January | 1,323.58 |
| 1 November | 1,546.64 | 29 January | 1,325.64 |
| 20 September | 1,546.03 | 26 December | 1,329.79 |
| 23 September | 1,540.73 | 3 February | 1,333.76 |
| 14 September | 1,536.21 | 26 January | 1,333.82 |
Sign allocation uses Asia/Kuala_Lumpur with historical local civil days and the stated within-day time-share assumption. Raw shares reflect sign length; the headline comparison uses births per sign day.
| Sign | Birth share (%) | Births per sign day | Per-day index |
|---|---|---|---|
| Aries | 8.15 | 1398.65 | 97.71 |
| Taurus | 8.39 | 1416.45 | 98.96 |
| Gemini | 8.58 | 1431.18 | 99.99 |
| Cancer | 8.59 | 1428.21 | 99.78 |
| Leo | 8.64 | 1443.66 | 100.86 |
| Virgo | 8.91 | 1506.6 | 105.26 |
| Libra | 8.75 | 1506.00 | 105.21 |
| Scorpio | 8.49 | 1484.0 | 103.67 |
| Sagittarius | 8.05 | 1424.3 | 99.51 |
| Capricorn | 7.77 | 1378.8 | 96.33 |
| Aquarius | 7.65 | 1351.05 | 94.39 |
| Pisces | 8.04 | 1403.1 | 98.02 |
The exclusive life path distribution uses the same source years and NinePath’s all-digits method. The calendar-date baseline uses those years too.
| Life path | Birth share (%) | Calendar-date share (%) |
|---|---|---|
| 1 | 11.13 | 11.11 |
| 2 | 4.18 | 4.26 |
| 3 | 11.05 | 11.08 |
| 4 | 7.89 | 7.87 |
| 5 | 11.06 | 11.10 |
| 6 | 8.62 | 8.74 |
| 7 | 11.13 | 11.13 |
| 8 | 11.18 | 11.14 |
| 9 | 11.17 | 11.13 |
| 11 | 6.90 | 6.83 |
| 22 | 3.17 | 3.23 |
| 33 | 2.51 | 2.38 |
Source: data.gov.my / National Registration Department (JPN), CC BY 4.0. Processed by NinePath. Source. Reuse terms.
Slovenia addition
In Slovenia, the most common birthday in 2000–2025 was 20 September, averaging 62.27 births per occurrence. The rarest regular birthday was 1 November, at 37.62.
The source labels January–August 2026 provisional. We exclude those partial-year months and use complete years through 2025, which are not marked provisional in this edition. Monthly totals are checked against their daily cells.
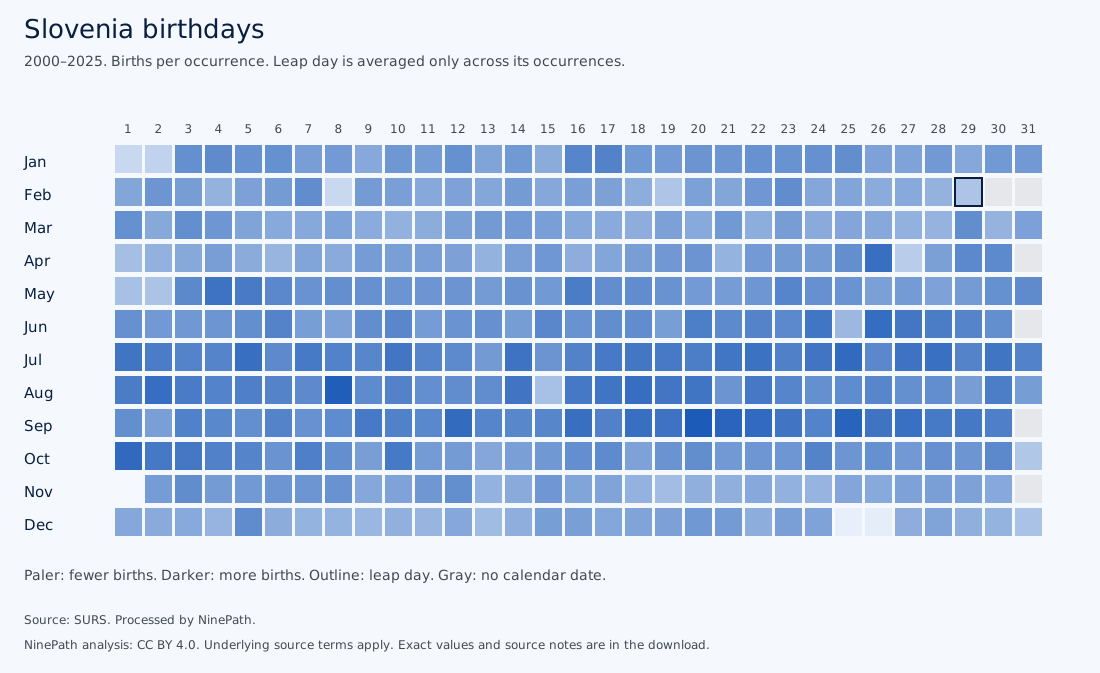
Swipe to see the whole chart
Leap day averaged 45.86 births across 7 occurrences. September had the highest birth-month rate at 57.07 births per day; December had the lowest at 49.31.
| Most common regular dates | Births per occurrence | Least common regular dates | Births per occurrence |
|---|---|---|---|
| 20 September | 62.27 | 1 November | 37.62 |
| 8 August | 61.77 | 25 December | 39.12 |
| 25 September | 60.96 | 26 December | 39.46 |
| 21 September | 60.81 | 1 January | 42.77 |
| 1 October | 60.04 | 8 February | 42.81 |
| 22 September | 59.96 | 2 January | 43.65 |
| 25 July | 59.92 | 27 April | 44.46 |
| 12 September | 59.77 | 31 October | 45.46 |
| 26 June | 59.50 | 19 February | 45.77 |
| 2 August | 59.27 | 2 May | 46.00 |
Sign allocation uses Europe/Ljubljana with historical local civil days and the stated within-day time-share assumption. Raw shares reflect sign length; the headline comparison uses births per sign day.
| Sign | Birth share (%) | Births per sign day | Per-day index |
|---|---|---|---|
| Aries | 7.96 | 50.58 | 95.34 |
| Taurus | 8.50 | 53.21 | 100.28 |
| Gemini | 8.65 | 53.53 | 100.89 |
| Cancer | 9.14 | 56.3 | 106.14 |
| Leo | 9.16 | 56.71 | 106.89 |
| Virgo | 8.9 | 56.09 | 105.72 |
| Libra | 8.66 | 55.25 | 104.13 |
| Scorpio | 7.91 | 51.35 | 96.79 |
| Sagittarius | 7.65 | 50.17 | 94.56 |
| Capricorn | 7.67 | 50.47 | 95.1 |
| Aquarius | 7.88 | 51.62 | 97.30 |
| Pisces | 7.86 | 50.83 | 95.81 |
The exclusive life path distribution uses the same source years and NinePath’s all-digits method. The calendar-date baseline uses those years too.
| Life path | Birth share (%) | Calendar-date share (%) |
|---|---|---|
| 1 | 11.06 | 11.12 |
| 2 | 6.46 | 6.37 |
| 3 | 11.09 | 11.11 |
| 4 | 6.38 | 6.55 |
| 5 | 11.12 | 11.11 |
| 6 | 11.16 | 11.10 |
| 7 | 11.16 | 11.11 |
| 8 | 11.11 | 11.11 |
| 9 | 11.21 | 11.13 |
| 11 | 4.59 | 4.75 |
| 22 | 4.66 | 4.55 |
| 33 | 0.00 | 0.00 |
Source: SURS. Processed by NinePath. Source. Reuse terms.
New Zealand addition
The most common birthday in the published New Zealand ranking for 1980–2023 registrations is 27 September. The rarest regular birthday is 25 December.
The ranks describe live births to New Zealand-resident mothers registered in New Zealand during 1980–2023. They do not provide counts by date and year. Both independent parsers read the workbook’s stored rank-formula values without evaluating formulas; their agreement does not independently confirm that those cached values are up to date. The separate estimated-population sheet is not used.
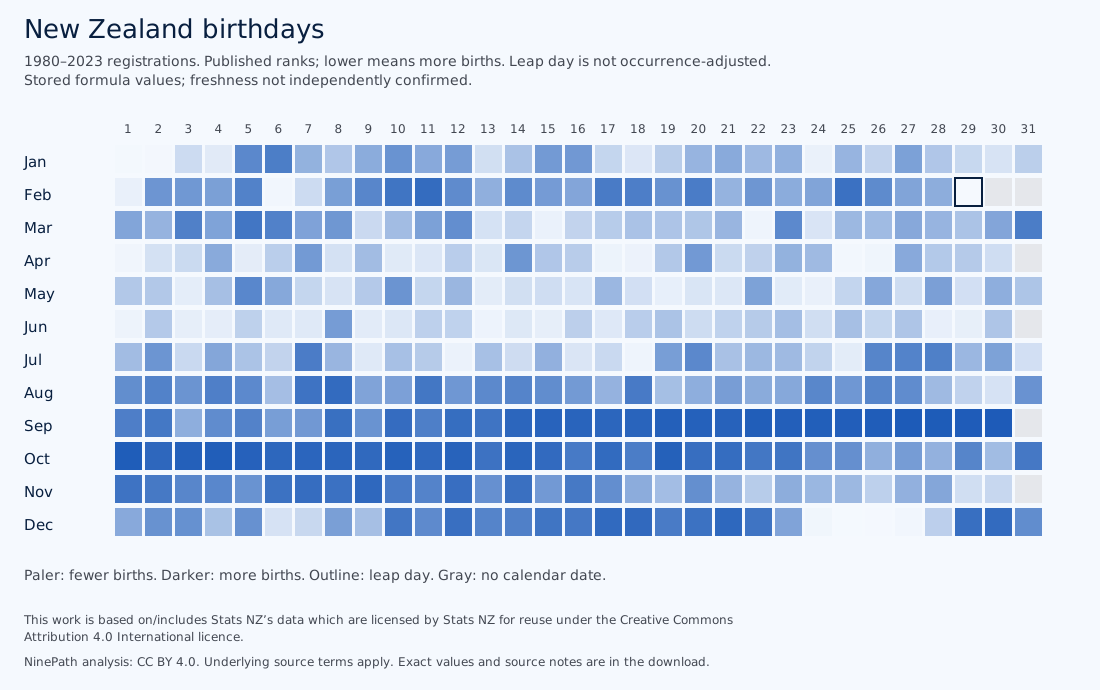
Swipe to see the whole chart
Leap day keeps its published rank of 366 without an occurrence correction. Ties retain the published rank.
| Most common regular dates | Published rank | Least common regular dates | Published rank |
|---|---|---|---|
| 27 September | 1 | 25 December | 365 |
| 30 September | 2 | 26 December | 364 |
| 28 September | 3 | 1 January | 363 |
| 29 September | 4 | 2 January | 362 |
| 1 October | 5 | 25 April | 361 |
| 26 September | 6 | 27 December | 360 |
| 22 September | 7 | 6 February | 359 |
| 4 October | 8 | 24 December | 358 |
| 25 September | 9 | 1 April | 357 |
| 24 September | 10 | 26 April | 356 |
The sign summary averages published birthday ranks, with leap day excluded. It does not estimate sign frequencies or birth shares. The registration window supplies equal calendar-year weights as an approximation. Pacific/Auckland is one representative zone; births in the Chatham Islands are approximated.
| Sign | Mean published birthday rank |
|---|---|
| Aries | 250.9 |
| Taurus | 265.8 |
| Gemini | 283.4 |
| Cancer | 248.4 |
| Leo | 151.1 |
| Virgo | 93.2 |
| Libra | 27.1 |
| Scorpio | 117.3 |
| Sagittarius | 151 |
| Capricorn | 226 |
| Aquarius | 188.8 |
| Pisces | 185.3 |
New Zealand has no life path or birth-month count distribution in this study.
This work is based on/includes Stats NZ’s data which are licensed by Stats NZ for reuse under the Creative Commons Attribution 4.0 International licence. Source. Reuse terms.
Additional country sign charts
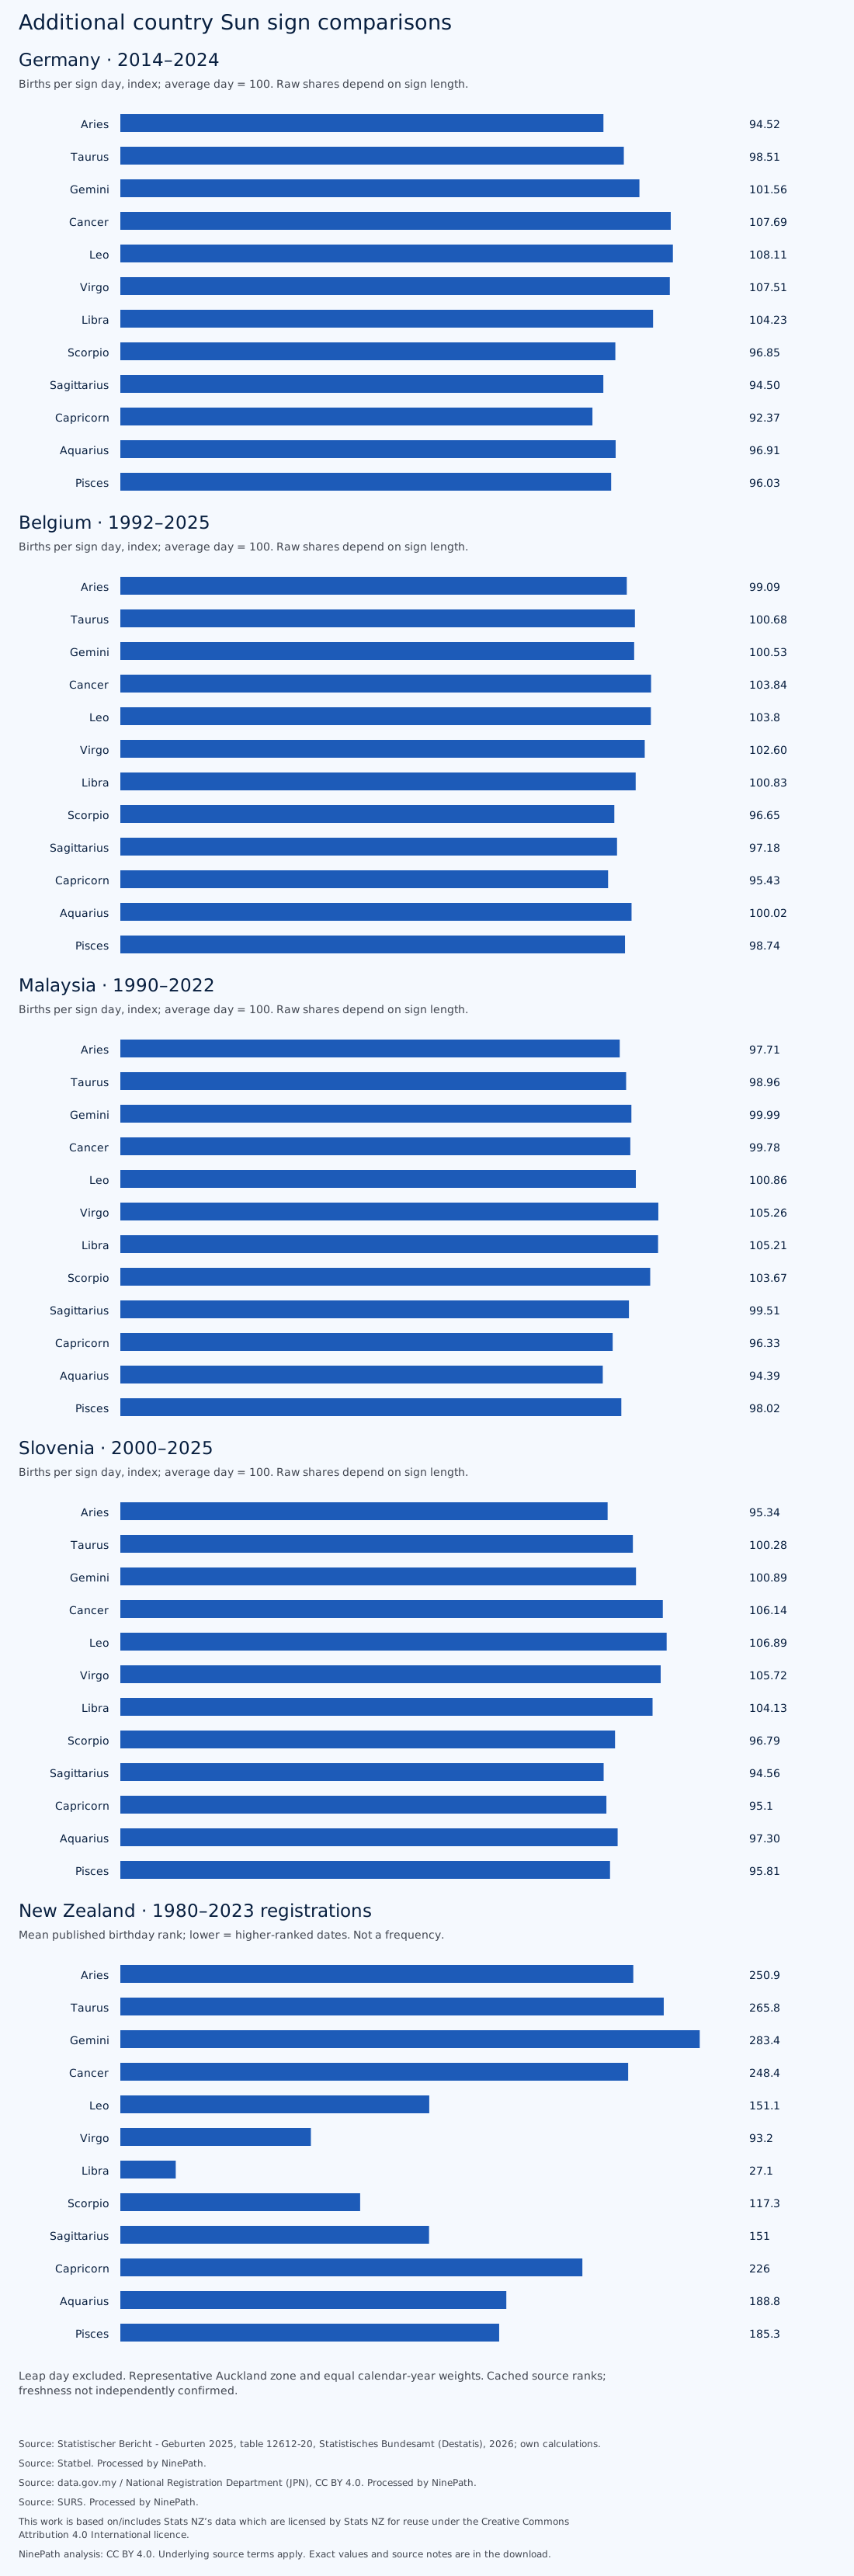
Swipe to see the whole chart
Additional country life path charts
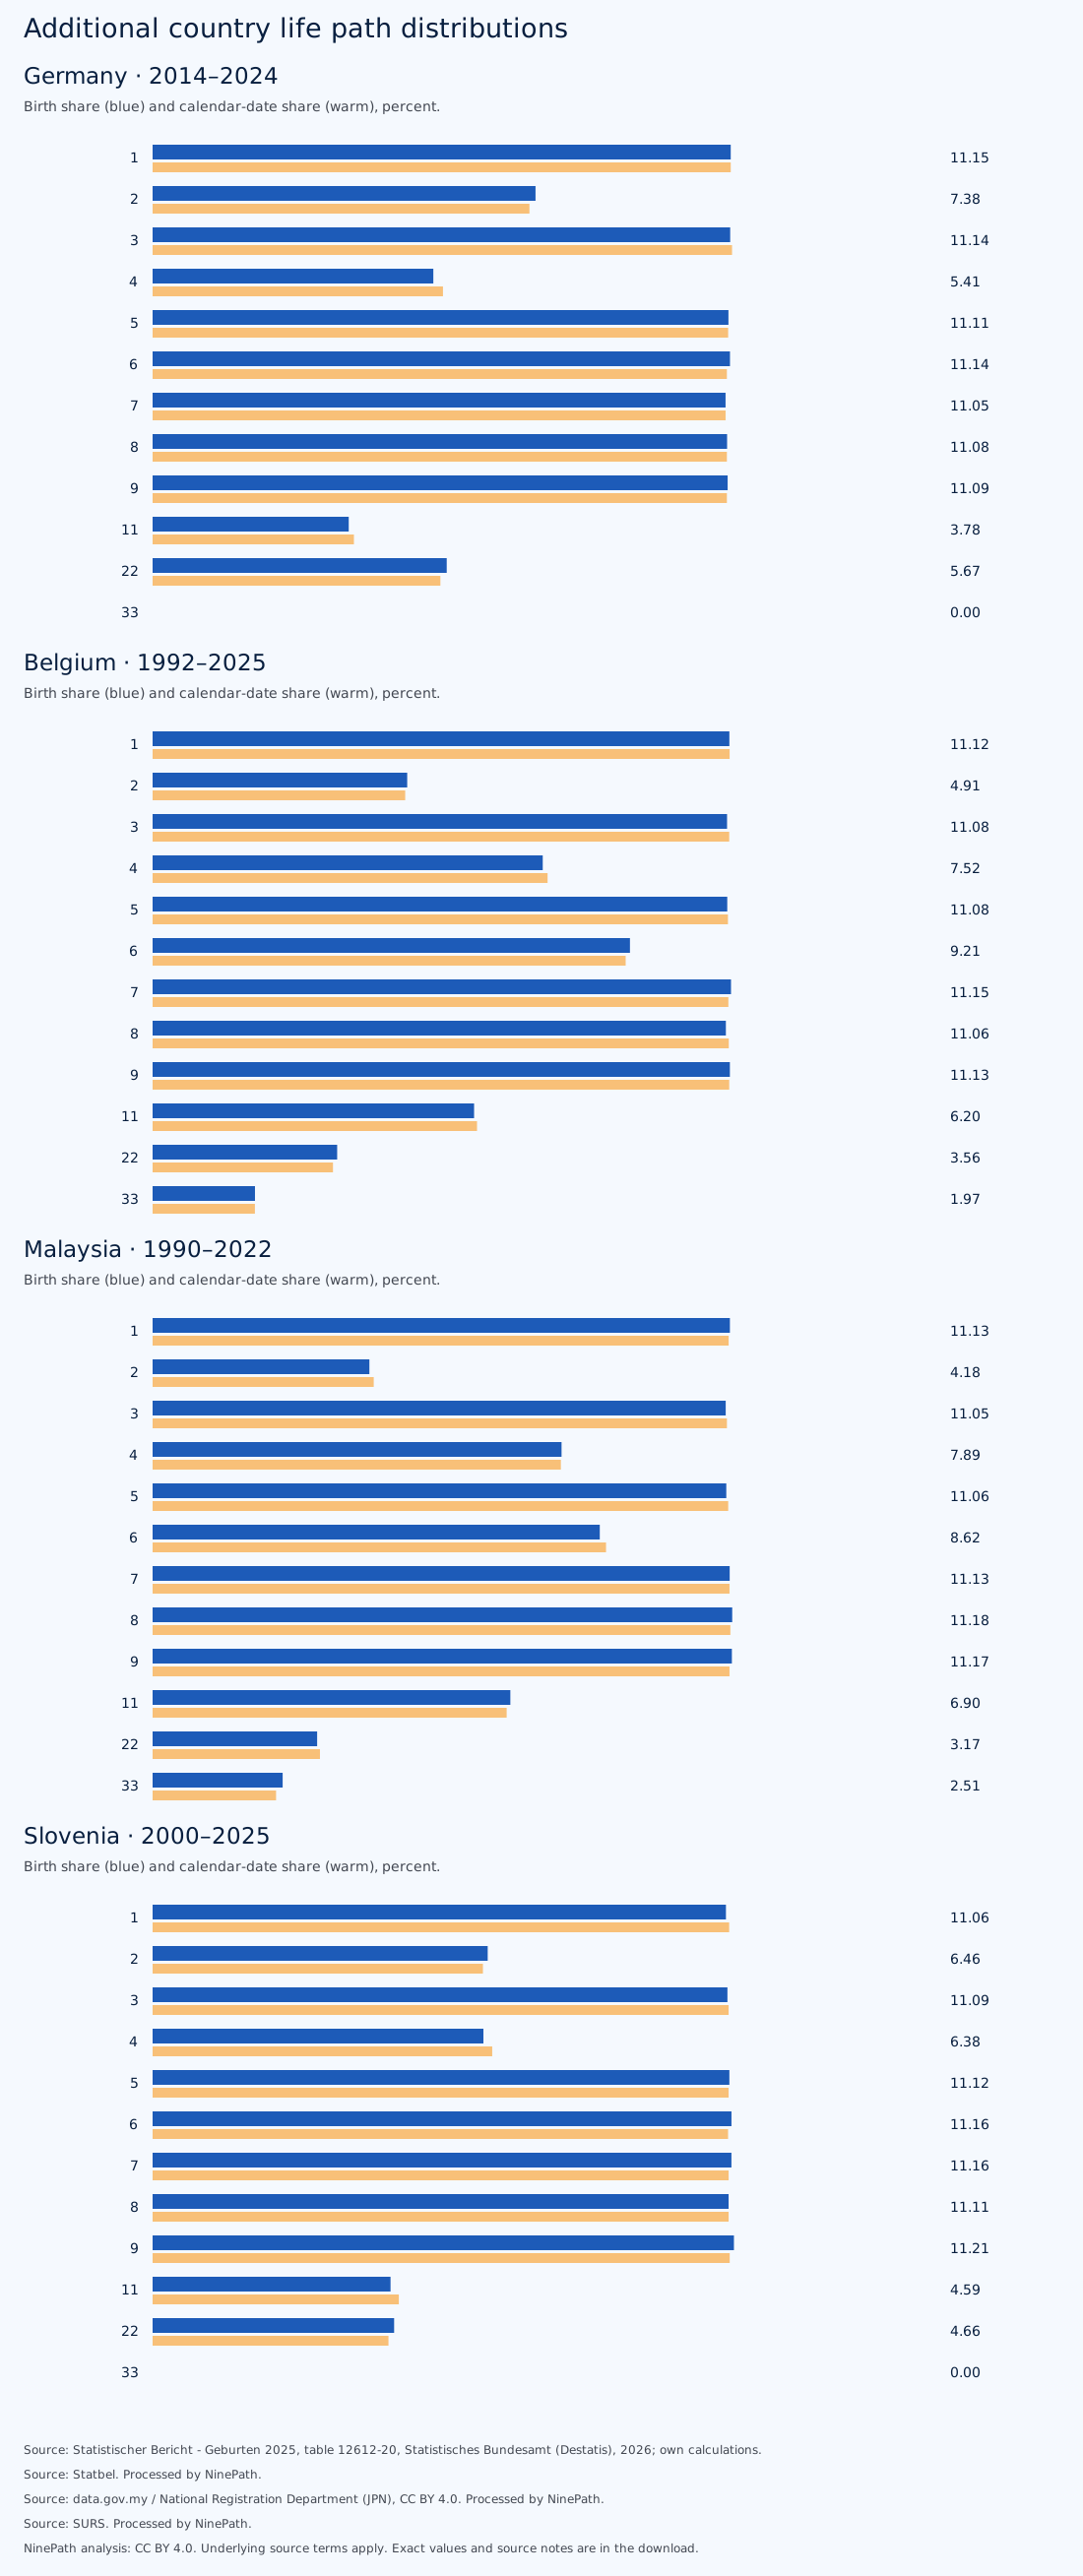
Swipe to see the whole chart
Questions people ask
Why are the periods different?
Daily birth statistics are available over different years in each source. Country sections use the available approved range; pooled comparisons use the shared window.
Was every value checked twice?
Published count measures pass the independent recount. Sign figures use agreed rounding. ABS and CSO source values receive supplementary checks. World tables publish agreed peak names only.
Can I reuse the download?
Yes. NinePath’s added analysis is under CC BY 4.0. Retain the source credits and check the underlying terms. UNdata does not explicitly state commercial-use rights.
Sources
- Source: CBS (Statistics Netherlands), StatLine table 70703ned
- Source : Insee, statistiques de l’état civil (T79JNAIS, Les naissances en 2025 et en séries longues, mise à jour du 06/07/2026)
- Source: Office for National Statistics licensed under the Open Government Licence v3.0
- Source: Statistics Denmark. Own calculations based on data from Statistics Denmark, StatBank.dk/foddag
- Source: FiveThirtyEight (CC BY 4.0), from CDC/NCHS (1994–2003) and Social Security Administration (2000–2014) data
- Fuente: INEGI, Estadística de Nacimientos Registrados. Processed by NinePath
- 出典:「人口動態調査」(厚生労働省)を加工して作成. Source: Vital Statistics of Japan (Ministry of Health, Labour and Welfare), via e-Stat. Processed by NinePath
- Source: ABS. Source: Australian Bureau of Statistics, Births, Australia, 2016 (cat. 3301.0), media release 13 December 2017, CC BY 4.0. © Commonwealth of Australia. Accessed 20 October 2026
- Source: CSO Ireland, VSD35 Birth Dates from 1980, CC BY 4.0. Processed by NinePath
- Source: UNdata (United Nations Statistics Division)
- Adapted from Statistics Canada, How common is your birthday?, 1995–2025. This does not constitute an endorsement by Statistics Canada of this product.
- Source: Statistischer Bericht - Geburten 2025, table 12612-20, Statistisches Bundesamt (Destatis), 2026; own calculations.
- Source: Statbel. Processed by NinePath.
- Source: data.gov.my / National Registration Department (JPN), CC BY 4.0. Processed by NinePath.
- Source: SURS. Processed by NinePath.
- This work is based on/includes Stats NZ’s data which are licensed by Stats NZ for reuse under the Creative Commons Attribution 4.0 International licence.