This is the zodiac companion to the World Birthday Study. The study method explains sources, local time and coverage.
Most common zodiac sign by country
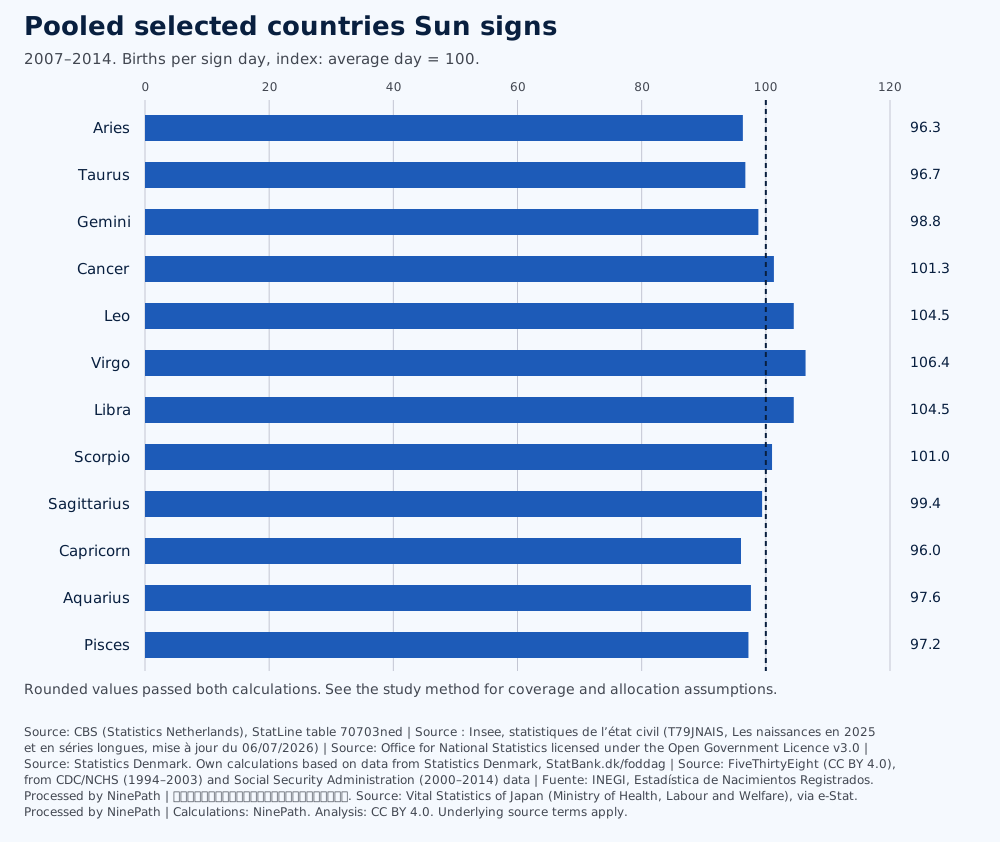
A sign’s per-day rate is its allocated births divided by the time the Sun spent in that sign, expressed as equivalent civil days. The rate index puts that country’s average day at 100. Higher means more births per day. These results describe recorded births.
| Country or pool | Years | Highest per day | Daily rate index | Lowest per day | Daily rate index | Largest raw share |
|---|---|---|---|---|---|---|
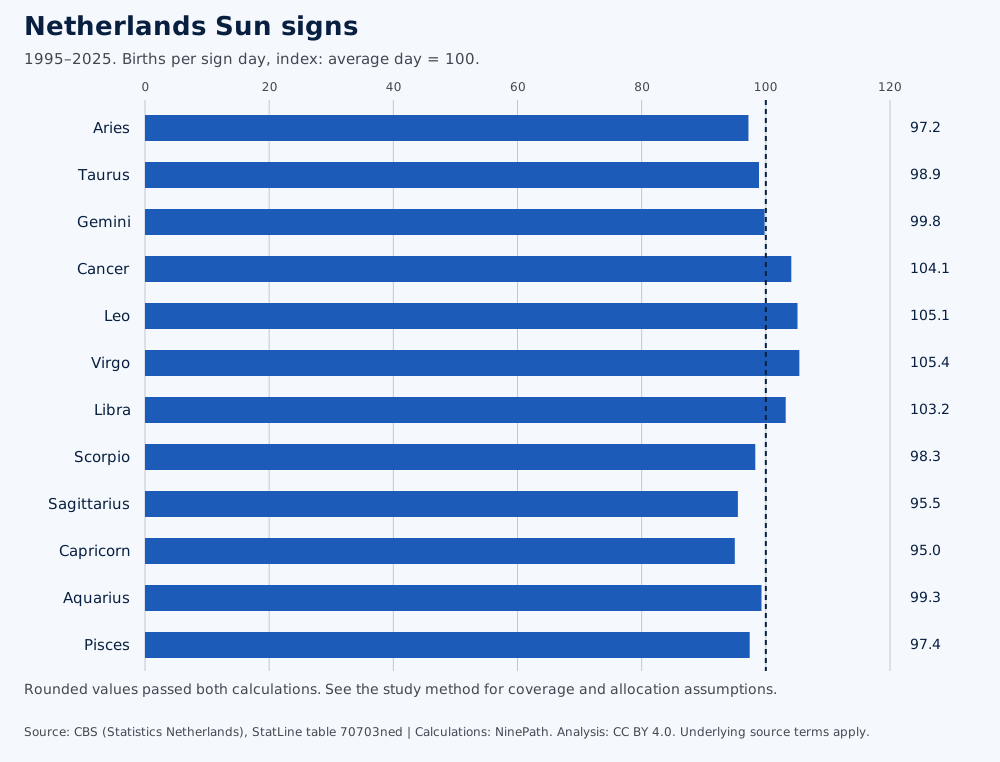
| Netherlands | 1995–2025 | Virgo | 105.4 | Capricorn | 95.0 | Leo |
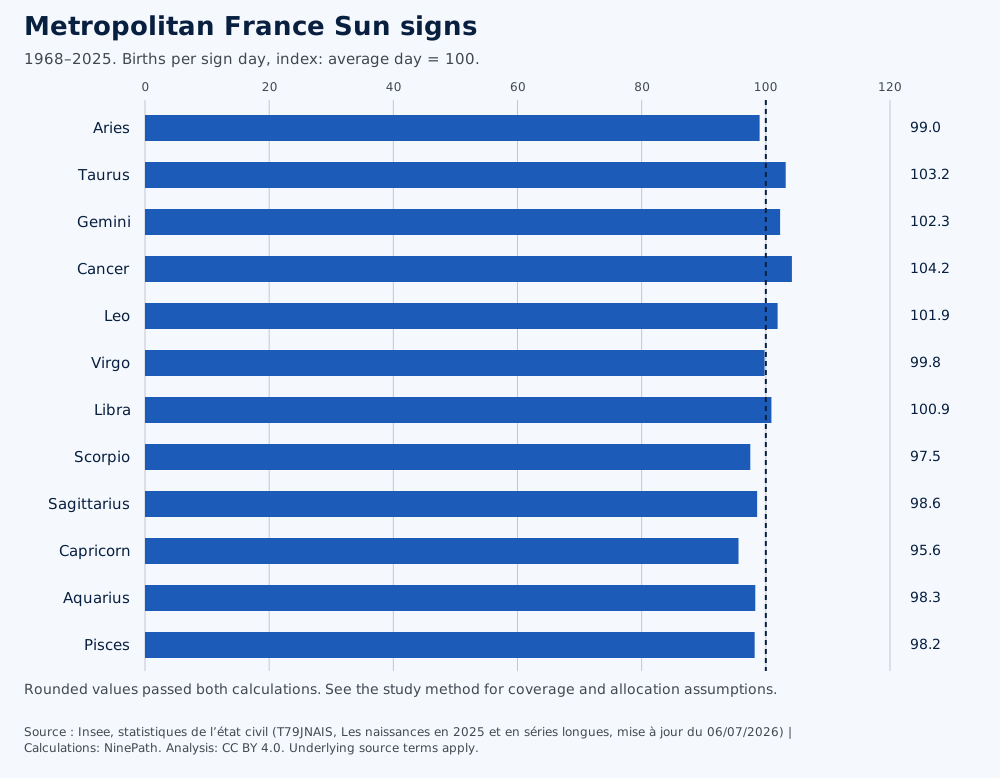
| Metropolitan France | 1968–2025 | Cancer | 104.2 | Capricorn | 95.6 | Cancer |
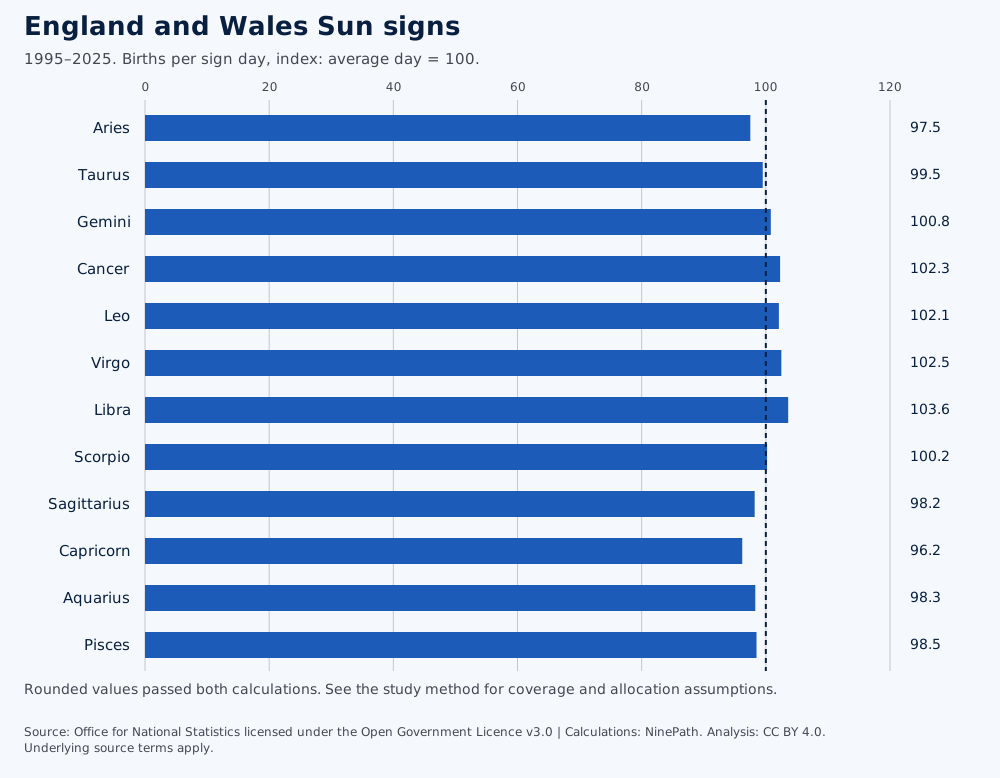
| England and Wales | 1995–2025 | Libra | 103.6 | Capricorn | 96.2 | Cancer |
| Denmark | 2007–2025 | Leo | 107.2 | Capricorn | 91.6 | Cancer |
| United States (SSA) | 2000–2014 | Virgo | 105.6 | Capricorn | 94.6 | Leo |
| Mexico | 1998–2021 | Virgo | 112.6 | Aries | 93.9 | Virgo |
| Japan | 1996–2025 | Leo | 104.0 | Aries | 96.6 | Leo |
| Pooled selected countries | 2007–2014 | Virgo | 106.4 | Capricorn | 96.0 | Virgo |
Additional country sign results
| Country | Source period | Highest per-day rate or highest-ranked dates | Lowest per-day rate or lowest-ranked dates |
|---|---|---|---|
| Germany | 2014–2024 | Leo | Capricorn |
| Belgium | 1992–2025 | Cancer | Capricorn |
| Malaysia | 1990–2022 | Virgo | Aquarius |
| Slovenia | 2000–2025 | Leo | Sagittarius |
| New Zealand | 1980–2023 registrations | Libra | Gemini |
New Zealand uses mean published birthday ranks, not a frequency estimate. Its highest-ranked dates have the lowest mean rank. Detailed tables and caveats.
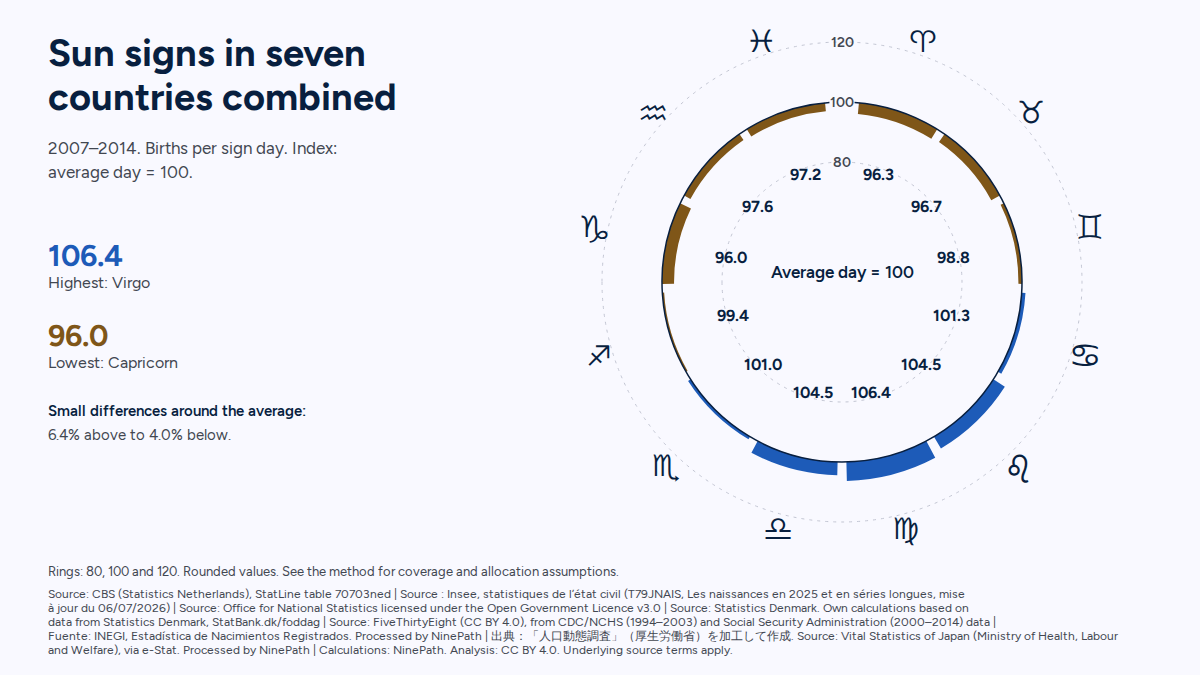
Why sign length changes the raw share
A longer sign season includes more days on which births can occur. That changes the raw share even if every day has the same birth rate. Births per sign day allow us to compare those seasons. The raw-share winner and the per-day winner can differ, as they do in several country rows above.
Per-country sign distributions
Rates and shares are estimates. Independent ephemerides place ingress times a few minutes apart. We publish only rounding that both counts support. The download records the rounding unit for rates.
Netherlands, 1995–2025
Swipe to see the whole chart
| Tropical Sun sign | Births per sign day (rounded) | Daily rate index | Raw share of births (%) |
|---|---|---|---|
| Aries | 485 | 97.2 | 8.1 |
| Taurus | 493 | 98.9 | 8.4 |
| Gemini | 498 | 99.8 | 8.6 |
| Cancer | 519 | 104.1 | 9.0 |
| Leo | 524 | 105.1 | 9.0 |
| Virgo | 526 | 105.4 | 8.9 |
| Libra | 515 | 103.2 | 8.6 |
| Scorpio | 491 | 98.3 | 8.0 |
| Sagittarius | 477 | 95.5 | 7.7 |
| Capricorn | 474 | 95.0 | 7.7 |
| Aquarius | 495 | 99.3 | 8.0 |
| Pisces | 486 | 97.4 | 8.0 |
Metropolitan France, 1968–2025
Swipe to see the whole chart
| Tropical Sun sign | Births per sign day (rounded) | Daily rate index | Raw share of births (%) |
|---|---|---|---|
| Aries | 2,062 | 99.0 | 8.3 |
| Taurus | 2,150 | 103.2 | 8.7 |
| Gemini | 2,130 | 102.3 | 8.8 |
| Cancer | 2,170 | 104.2 | 9.0 |
| Leo | 2,123 | 101.9 | 8.7 |
| Virgo | 2,079 | 99.8 | 8.4 |
| Libra | 2,101 | 100.9 | 8.4 |
| Scorpio | 2,031 | 97.5 | 8.0 |
| Sagittarius | 2,055 | 98.6 | 8.0 |
| Capricorn | 1,992 | 95.6 | 7.7 |
| Aquarius | 2,048 | 98.3 | 8.0 |
| Pisces | 2,046 | 98.2 | 8.1 |
England and Wales, 1995–2025
Swipe to see the whole chart
| Tropical Sun sign | Births per sign day (rounded) | Daily rate index | Raw share of births (%) |
|---|---|---|---|
| Aries | 1,742 | 97.5 | 8.1 |
| Taurus | 1,777 | 99.5 | 8.4 |
| Gemini | 1,801 | 100.8 | 8.6 |
| Cancer | 1,828 | 102.3 | 8.8 |
| Leo | 1,825 | 102.1 | 8.8 |
| Virgo | 1,831 | 102.5 | 8.7 |
| Libra | 1,850 | 103.6 | 8.6 |
| Scorpio | 1,791 | 100.2 | 8.2 |
| Sagittarius | 1,754 | 98.2 | 7.9 |
| Capricorn | 1,718 | 96.2 | 7.8 |
| Aquarius | 1,757 | 98.3 | 8.0 |
| Pisces | 1,760 | 98.5 | 8.1 |
Denmark, 2007–2025
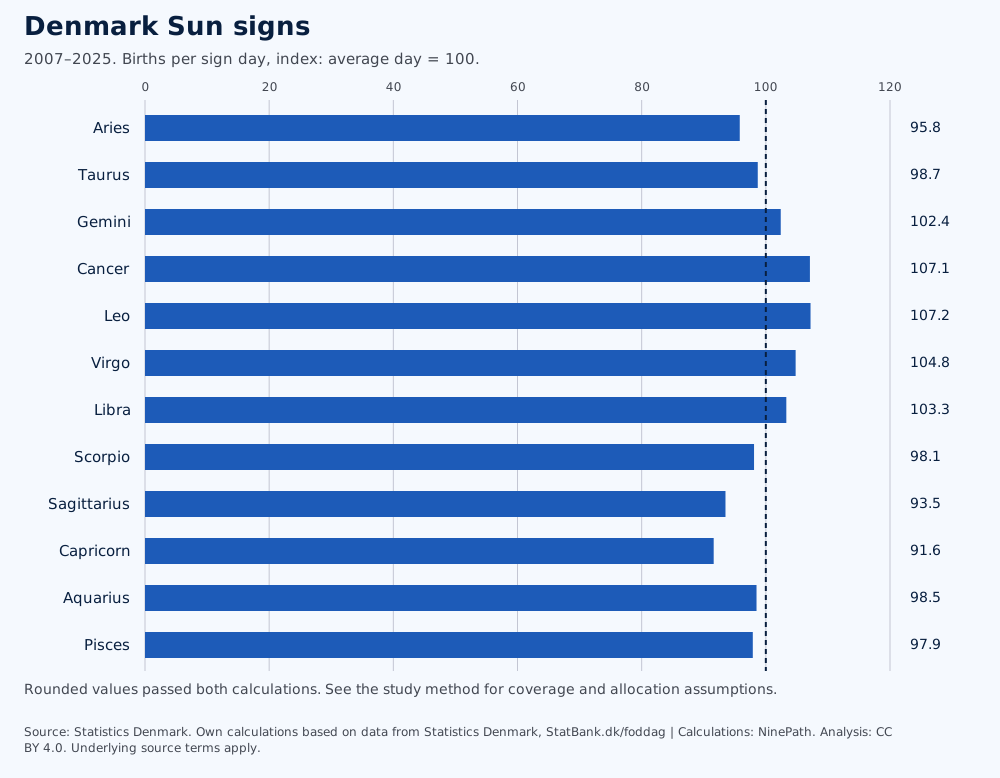
Swipe to see the whole chart
| Tropical Sun sign | Births per sign day (rounded) | Daily rate index | Raw share of births (%) |
|---|---|---|---|
| Aries | 158 | 95.8 | 8.0 |
| Taurus | 163 | 98.7 | 8.4 |
| Gemini | 169 | 102.4 | 8.8 |
| Cancer | 177 | 107.1 | 9.2 |
| Leo | 177 | 107.2 | 9.2 |
| Virgo | 173 | 104.8 | 8.9 |
| Libra | 171 | 103.3 | 8.6 |
| Scorpio | 162 | 98.1 | 8.0 |
| Sagittarius | 154 | 93.5 | 7.6 |
| Capricorn | 151 | 91.6 | 7.4 |
| Aquarius | 163 | 98.5 | 8.0 |
| Pisces | 162 | 97.9 | 8.0 |
United States (SSA), 2000–2014
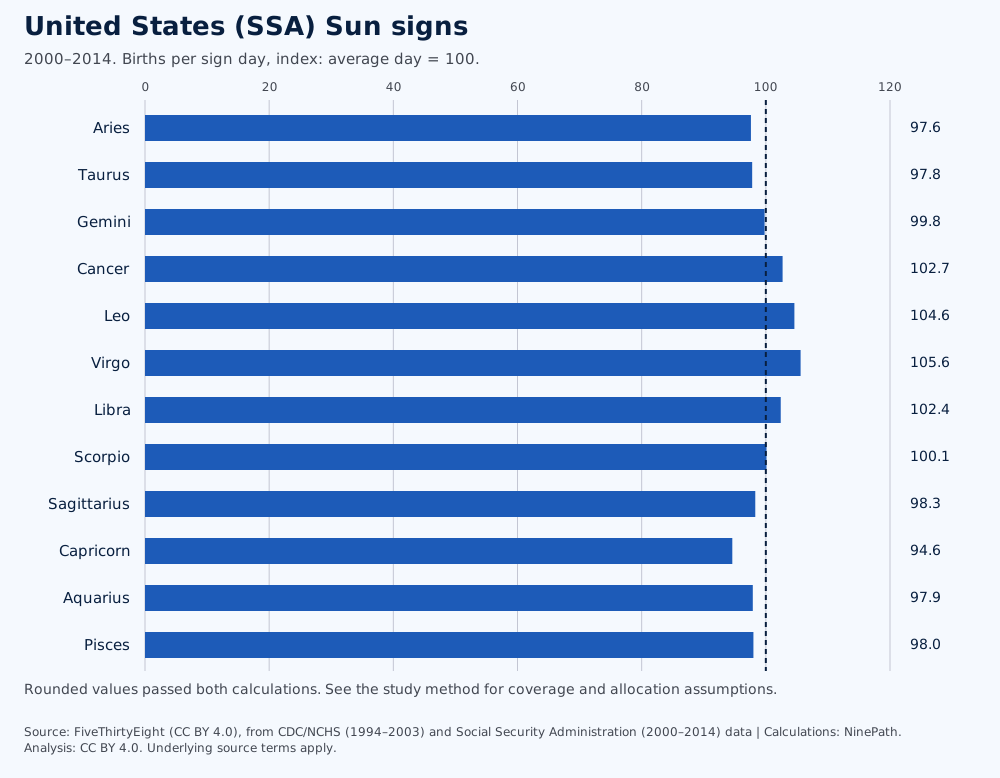
Swipe to see the whole chart
| Tropical Sun sign | Births per sign day (rounded) | Daily rate index | Raw share of births (%) |
|---|---|---|---|
| Aries | 11,079 | 97.6 | 8.1 |
| Taurus | 11,102 | 97.8 | 8.3 |
| Gemini | 11,329 | 99.8 | 8.6 |
| Cancer | 11,656 | 102.7 | 8.8 |
| Leo | 11,871 | 104.6 | 9.0 |
| Virgo | 11,988 | 105.6 | 8.9 |
| Libra | 11,619 | 102.4 | 8.5 |
| Scorpio | 11,362 | 100.1 | 8.2 |
| Sagittarius | 11,155 | 98.3 | 8.0 |
| Capricorn | 10,740 | 94.6 | 7.6 |
| Aquarius | 11,110 | 97.9 | 7.9 |
| Pisces | 11,123 | 98.0 | 8.0 |
Mexico, 1998–2021
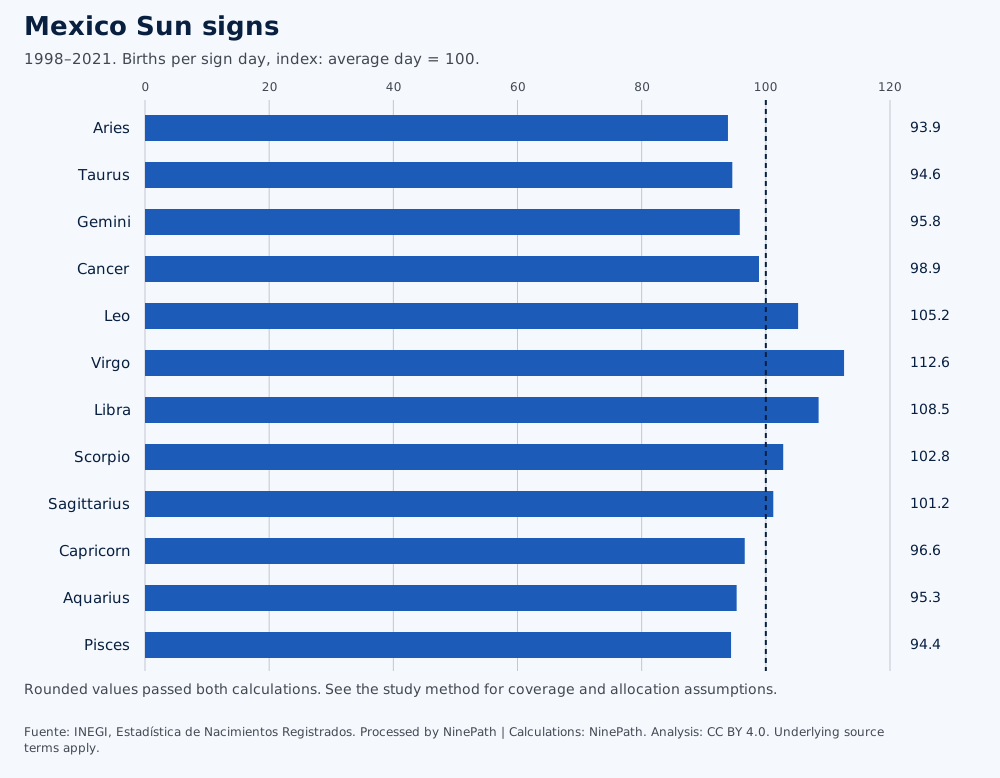
Swipe to see the whole chart
| Tropical Sun sign | Births per sign day (rounded) | Daily rate index | Raw share of births (%) |
|---|---|---|---|
| Aries | 5,857 | 93.9 | 7.8 |
| Taurus | 5,902 | 94.6 | 8.0 |
| Gemini | 5,976 | 95.8 | 8.2 |
| Cancer | 6,168 | 98.9 | 8.5 |
| Leo | 6,564 | 105.2 | 9.0 |
| Virgo | 7,023 | 112.6 | 9.5 |
| Libra | 6,767 | 108.5 | 9.0 |
| Scorpio | 6,411 | 102.8 | 8.4 |
| Sagittarius | 6,313 | 101.2 | 8.2 |
| Capricorn | 6,027 | 96.6 | 7.8 |
| Aquarius | 5,942 | 95.3 | 7.7 |
| Pisces | 5,890 | 94.4 | 7.7 |
Japan, 1996–2025
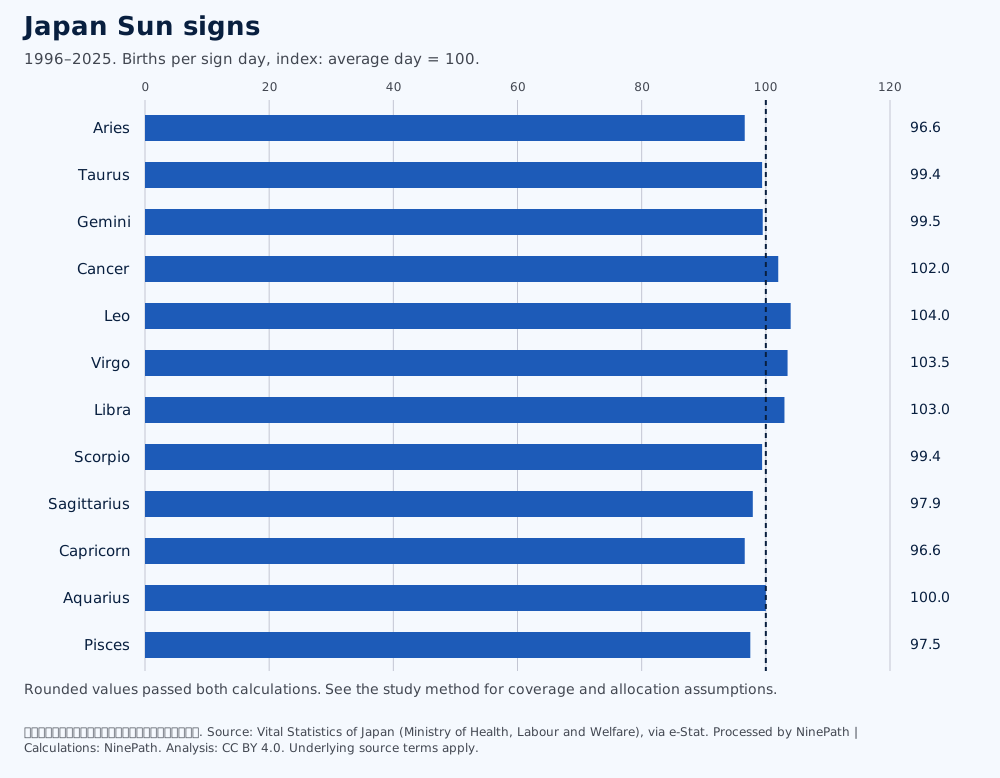
Swipe to see the whole chart
| Tropical Sun sign | Births per sign day (rounded) | Daily rate index | Raw share of births (%) |
|---|---|---|---|
| Aries | 2,674 | 96.6 | 8.1 |
| Taurus | 2,752 | 99.4 | 8.4 |
| Gemini | 2,757 | 99.5 | 8.5 |
| Cancer | 2,825 | 102.0 | 8.8 |
| Leo | 2,882 | 104.0 | 8.9 |
| Virgo | 2,867 | 103.5 | 8.8 |
| Libra | 2,854 | 103.0 | 8.6 |
| Scorpio | 2,754 | 99.4 | 8.1 |
| Sagittarius | 2,711 | 97.9 | 7.9 |
| Capricorn | 2,670 | 96.6 | 7.8 |
| Aquarius | 2,769 | 100.0 | 8.1 |
| Pisces | 2,702 | 97.5 | 8.0 |
Pooled selected countries, 2007–2014
Swipe to see the whole chart
| Tropical Sun sign | Births per sign day (rounded) | Daily rate index | Raw share of births (%) |
|---|---|---|---|
| Aries | 24,394 | 96.3 | 8.0 |
| Taurus | 24,510 | 96.7 | 8.2 |
| Gemini | 25,030 | 98.8 | 8.5 |
| Cancer | 25,655 | 101.3 | 8.7 |
| Leo | 26,482 | 104.5 | 9.0 |
| Virgo | 26,943 | 106.4 | 9.0 |
| Libra | 26,463 | 104.5 | 8.7 |
| Scorpio | 25,585 | 101.0 | 8.3 |
| Sagittarius | 25,181 | 99.4 | 8.0 |
| Capricorn | 24,316 | 96.0 | 7.7 |
| Aquarius | 24,730 | 97.6 | 7.9 |
| Pisces | 24,616 | 97.2 | 8.0 |
Australia: a rank summary only
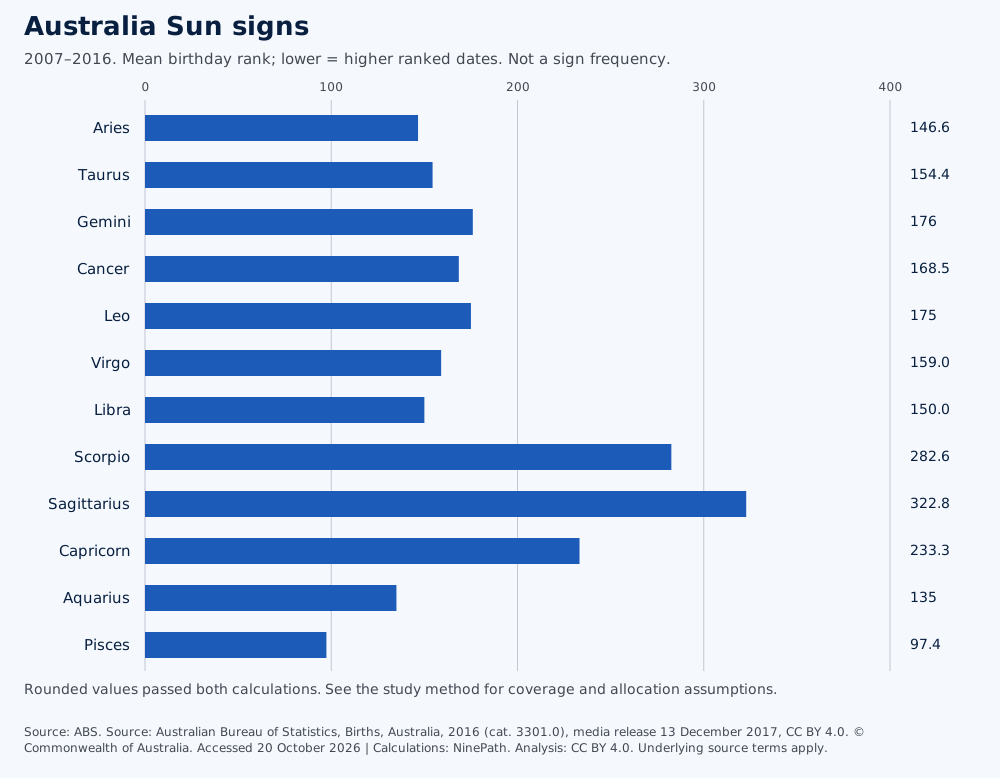
The ABS birthday table for 2007–2016 has ranks rather than complete counts. We cannot identify the most common or rarest zodiac sign by population share or births per day from those ranks. The table below gives the mean published birthday rank of each sign’s dates. Lower means those dates tended to rank nearer the top. This is not a sign-frequency estimate. Leap day is excluded.
Swipe to see the whole chart
| Sign | Mean birthday rank (rounded) |
|---|---|
| Aries | 146.6 |
| Taurus | 154.4 |
| Gemini | 176 |
| Cancer | 168.5 |
| Leo | 175 |
| Virgo | 159.0 |
| Libra | 150.0 |
| Scorpio | 282.6 |
| Sagittarius | 322.8 |
| Capricorn | 233.3 |
| Aquarius | 135 |
| Pisces | 97.4 |
Source: ABS. Source: Australian Bureau of Statistics, Births, Australia, 2016 (cat. 3301.0), media release 13 December 2017, CC BY 4.0. © Commonwealth of Australia. Accessed 20 October 2026
Canada: a rank summary only
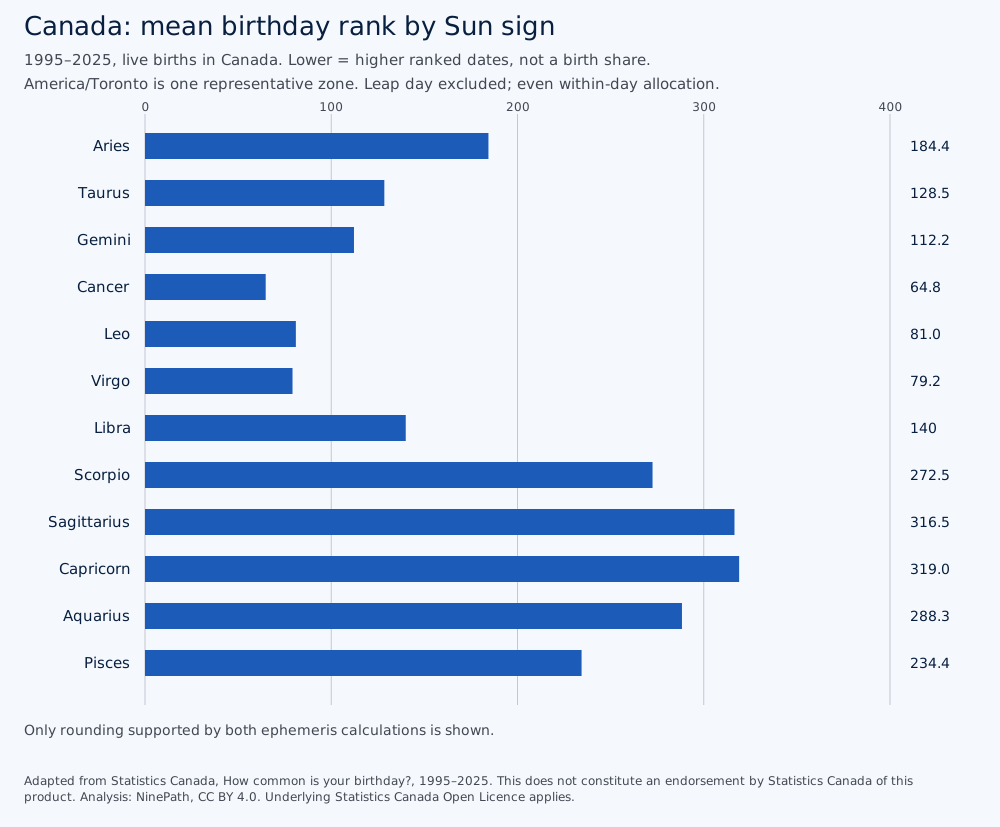
Statistics Canada's chart covers 1995–2025, live births in Canada. As with Australia, ranks cannot reveal a sign's share of births or its births per day. The table gives the mean published birthday rank of each sign's dates. Lower means those dates tended to rank nearer the top. It is not a sign-frequency estimate.
We average the date-to-sign allocation across the stated birth years. Each regular calendar date has equal weight before the sign-day fractions are applied. Leap day is excluded. Canada uses America/Toronto as one representative Eastern zone, chosen for the population concentration in Ontario and Quebec. This is an approximation. Within-day splitting assumes an even distribution over the local day.
Swipe to see the whole chart
| Sign | Mean birthday rank (rounded) |
|---|---|
| Aries | 184.4 |
| Taurus | 128.5 |
| Gemini | 112.2 |
| Cancer | 64.8 |
| Leo | 81.0 |
| Virgo | 79.2 |
| Libra | 140 |
| Scorpio | 272.5 |
| Sagittarius | 316.5 |
| Capricorn | 319.0 |
| Aquarius | 288.3 |
| Pisces | 234.4 |
Adapted from Statistics Canada, How common is your birthday?, 1995–2025. This does not constitute an endorsement by Statistics Canada of this product. Original chart.
Ireland: sign estimates withheld
We show Ireland’s published birthday averages in the main study. We withhold its sign estimates because the CSO table does not state the exact reference period. A period is needed to average the year-specific ingress dates. Inferring the last birth year from the edition label would add an unconfirmed assumption.
How we split dates when the Sun changes sign
Signs come from the tropical ephemeris for each year. On ingress days we split births at the change in local civil time. Except in Japan, splitting by time share assumes births are spread evenly through that day. Japan uses recorded birth hours, with a uniform split within the ingress hour.
The US uses America/Chicago and Mexico uses America/Mexico_City as representative zones. Those countries span multiple zones, so their ingress-day allocations are approximations. Australia’s rank summary uses Australia/Sydney. The method page lists every zone and explains unknown birth hours.
Read how NinePath reads your sky. For the other calendar-based distribution, see the most common life path number. For sign basics, see zodiac sign dates.
Questions people ask
What is the rarest zodiac sign?
Capricorn has the lowest per-day rate in the selected-country pool for 2007–2014. This is not a global estimate. The lowest sign differs between countries.
Does a larger raw share mean more births per day?
Not necessarily. A sign that lasts longer has more birth days in its total. We report both raw share and births per sign day.
Can these statistics describe an individual?
No. These tables describe frequencies in birth records. They do not establish personal qualities or future events.
Sources
- Source: CBS (Statistics Netherlands), StatLine table 70703ned
- Source : Insee, statistiques de l’état civil (T79JNAIS, Les naissances en 2025 et en séries longues, mise à jour du 06/07/2026)
- Source: Office for National Statistics licensed under the Open Government Licence v3.0
- Source: Statistics Denmark. Own calculations based on data from Statistics Denmark, StatBank.dk/foddag
- Source: FiveThirtyEight (CC BY 4.0), from CDC/NCHS (1994–2003) and Social Security Administration (2000–2014) data
- Fuente: INEGI, Estadística de Nacimientos Registrados. Processed by NinePath
- 出典:「人口動態調査」(厚生労働省)を加工して作成. Source: Vital Statistics of Japan (Ministry of Health, Labour and Welfare), via e-Stat. Processed by NinePath
- Source: ABS. Source: Australian Bureau of Statistics, Births, Australia, 2016 (cat. 3301.0), media release 13 December 2017, CC BY 4.0. © Commonwealth of Australia. Accessed 20 October 2026
- Source: CSO Ireland, VSD35 Birth Dates from 1980, CC BY 4.0. Processed by NinePath
- Source: UNdata (United Nations Statistics Division)
- Adapted from Statistics Canada, How common is your birthday?, 1995–2025. This does not constitute an endorsement by Statistics Canada of this product.
- Source: Statistischer Bericht - Geburten 2025, table 12612-20, Statistisches Bundesamt (Destatis), 2026; own calculations.
- Source: Statbel. Processed by NinePath.
- Source: data.gov.my / National Registration Department (JPN), CC BY 4.0. Processed by NinePath.
- Source: SURS. Processed by NinePath.
- This work is based on/includes Stats NZ’s data which are licensed by Stats NZ for reuse under the Creative Commons Attribution 4.0 International licence.