This is the numerology companion to the World Birthday Study. Read how NinePath calculates your numbers for the calculation used here.
The most common life path number by country
Countries have different birth-year coverage. This first table describes each source on its own. It cannot separate country differences from year differences.
| Country | Birth years | Most common | Share (%) | Least common | Share (%) |
|---|---|---|---|---|---|
| Netherlands | 1995–2025 | 3 | 11.12 | 33 | 1.32 |
| Metropolitan France | 1968–2025 | 5 | 11.12 | 22 | 2.50 |
| England and Wales | 1995–2025 | 3 | 11.13 | 33 | 1.22 |
| Denmark | 2007–2025 | 5 | 11.21 | 33 | 0.00 |
| United States (SSA) | 2000–2014 | 9 | 11.17 | 33 | 0.00 |
| Mexico | 1998–2021 | 5 | 11.15 | 33 | 0.59 |
| Japan | 1996–2025 | 3 | 11.13 | 33 | 1.14 |
Additional country life path results
These distributions mostly mirror the dates and years available. They do not change the original pooled comparison.
Detailed distributions and calendar baselines are on the method page. New Zealand has no life path count data.
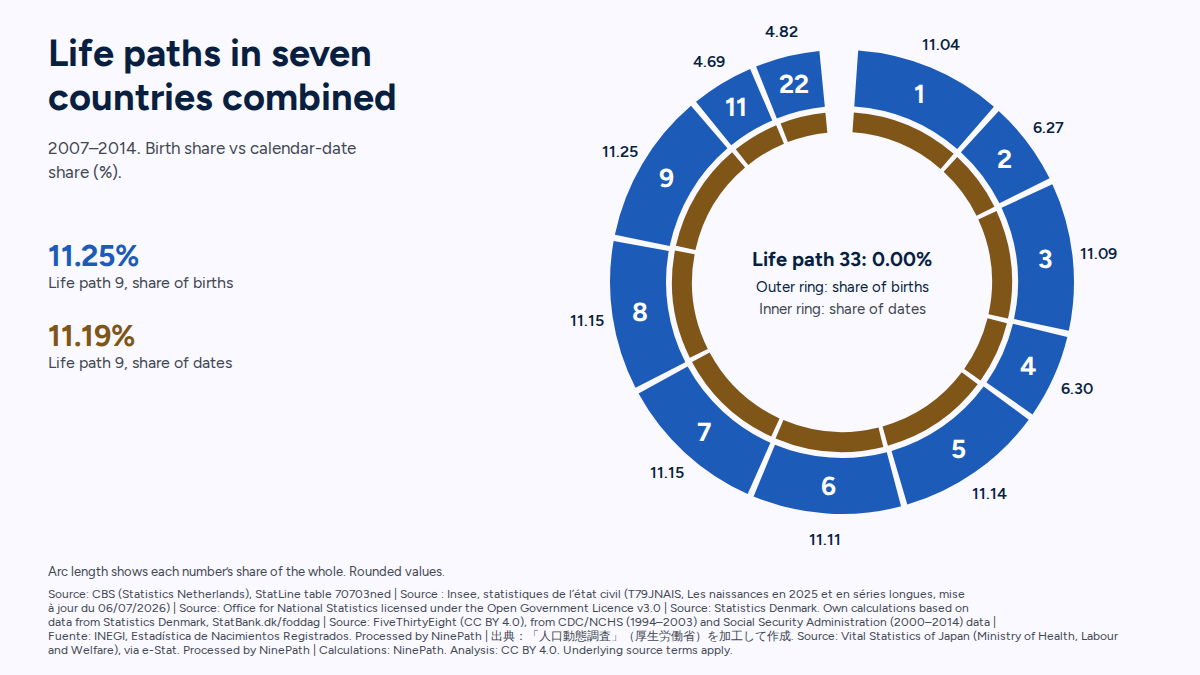
Compare the same birth years
The shared-years comparison uses 2007–2014 in every country. It keeps the calendar period fixed. Each cell gives the share of recorded births. Master numbers stay in their own rows.
| Life path | Netherlands | Metropolitan France | England and Wales | Denmark | United States (SSA) | Mexico | Japan | Pooled |
|---|---|---|---|---|---|---|---|---|
| 1 | 11.03 | 11.02 | 11.08 | 11.01 | 11.02 | 11.07 | 11.02 | 11.04 |
| 2 | 6.29 | 6.26 | 6.20 | 6.39 | 6.28 | 6.25 | 6.28 | 6.27 |
| 3 | 11.07 | 11.11 | 11.09 | 11.15 | 11.07 | 11.09 | 11.11 | 11.09 |
| 4 | 6.28 | 6.37 | 6.39 | 6.22 | 6.26 | 6.31 | 6.33 | 6.30 |
| 5 | 11.18 | 11.12 | 11.14 | 11.16 | 11.13 | 11.19 | 11.05 | 11.14 |
| 6 | 11.13 | 11.10 | 11.11 | 11.09 | 11.11 | 11.12 | 11.09 | 11.11 |
| 7 | 11.18 | 11.15 | 11.13 | 11.14 | 11.15 | 11.12 | 11.20 | 11.15 |
| 8 | 11.14 | 11.14 | 11.15 | 11.20 | 11.16 | 11.12 | 11.19 | 11.15 |
| 9 | 11.23 | 11.23 | 11.25 | 11.21 | 11.27 | 11.22 | 11.25 | 11.25 |
| 11 | 4.67 | 4.75 | 4.78 | 4.57 | 4.64 | 4.74 | 4.68 | 4.69 |
| 22 | 4.80 | 4.73 | 4.68 | 4.85 | 4.90 | 4.77 | 4.81 | 4.82 |
| 33 | 0.00 | 0.00 | 0.00 | 0.00 | 0.00 | 0.00 | 0.00 | 0.00 |
The pool adds raw birth counts. It does not give each country equal weight and does not estimate a worldwide distribution.
Birth frequency mostly follows calendar frequency
The year contributes to the digit sum. Some results have more calendar dates available than others, even before births enter the calculation. The table compares the pooled birth share with the share of calendar dates carrying each number in the same period. It is a descriptive comparison, rather than a test of a personal trait.
| Life path | Share of dates, 2007–2014 (%) | Share of pooled births (%) |
|---|---|---|
| 1 | 11.09 | 11.04 |
| 2 | 6.30 | 6.27 |
| 3 | 11.09 | 11.09 |
| 4 | 6.40 | 6.30 |
| 5 | 11.16 | 11.14 |
| 6 | 11.09 | 11.11 |
| 7 | 11.16 | 11.15 |
| 8 | 11.12 | 11.15 |
| 9 | 11.19 | 11.25 |
| 11 | 4.76 | 4.69 |
| 22 | 4.65 | 4.82 |
| 33 | 0.00 | 0.00 |
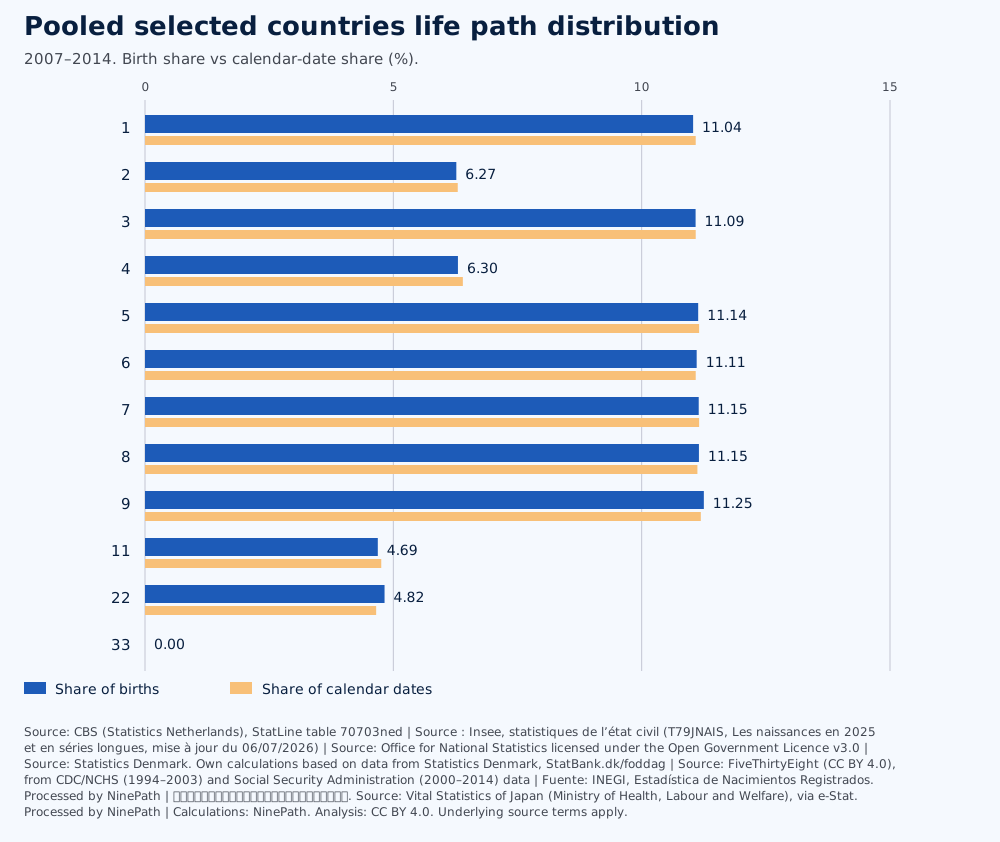
Swipe to see the whole chart
Why life path 33 is absent in recent years
No valid birth date from 2000 to 2025 produces life path 33 under NinePath’s all-eight-digits method. Both enumerations checked the calendar. The largest initial digit sum in that range is 32. Further digit reduction cannot reach a higher total. This statement is limited to those years and this method. Earlier periods can contain the number.
Country distributions
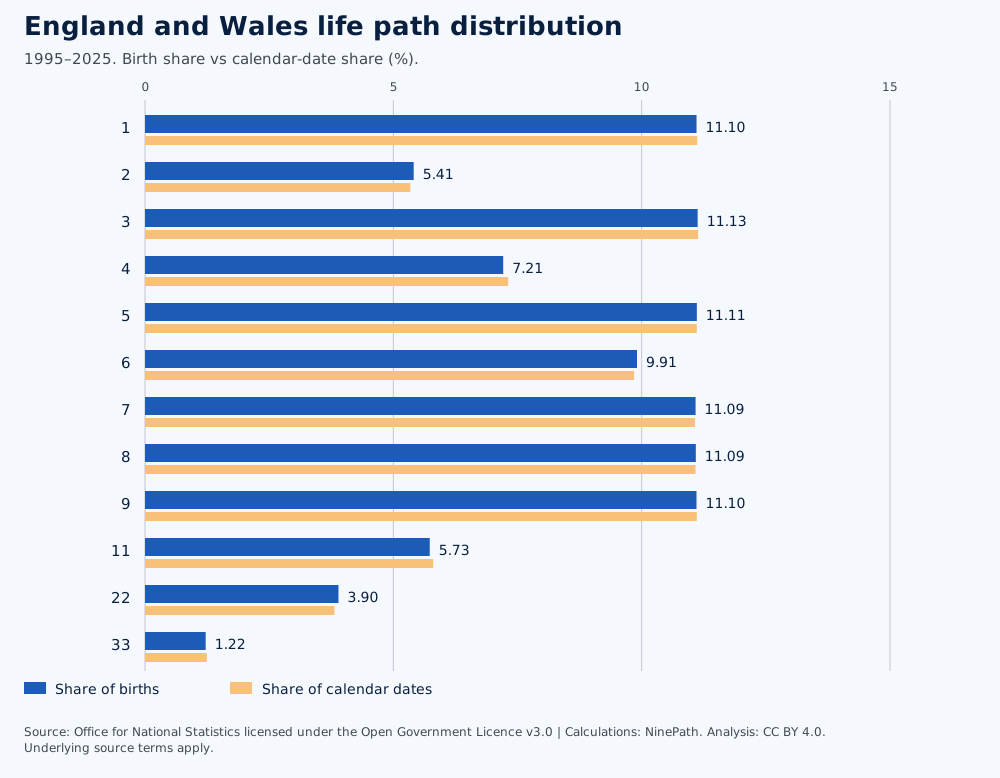
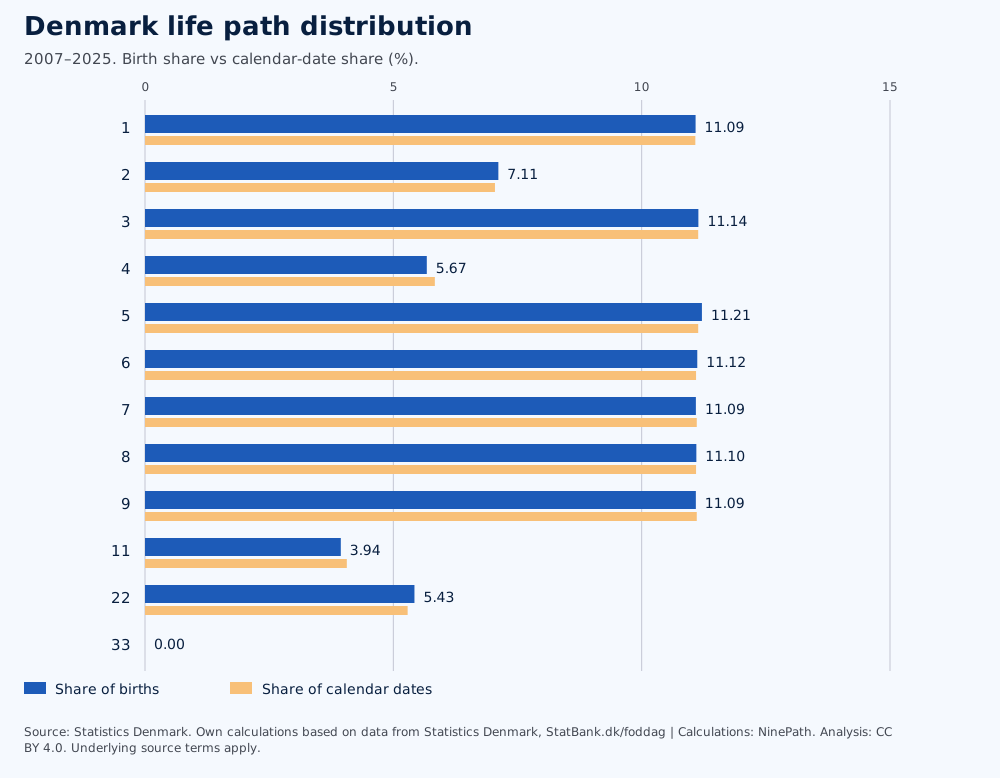
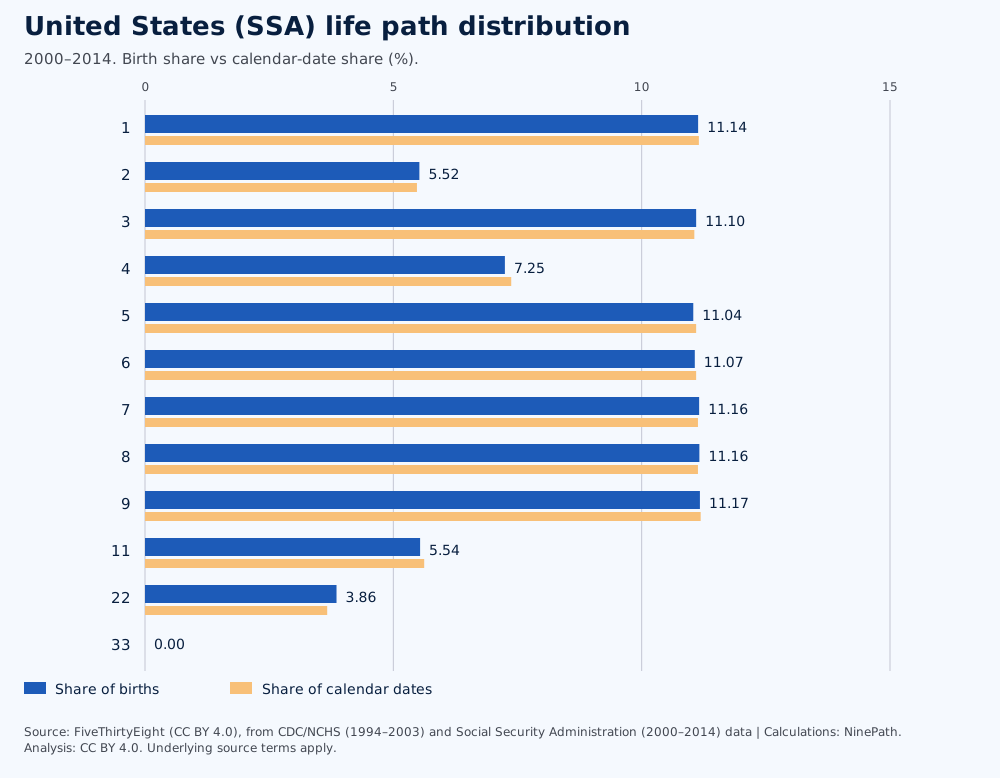
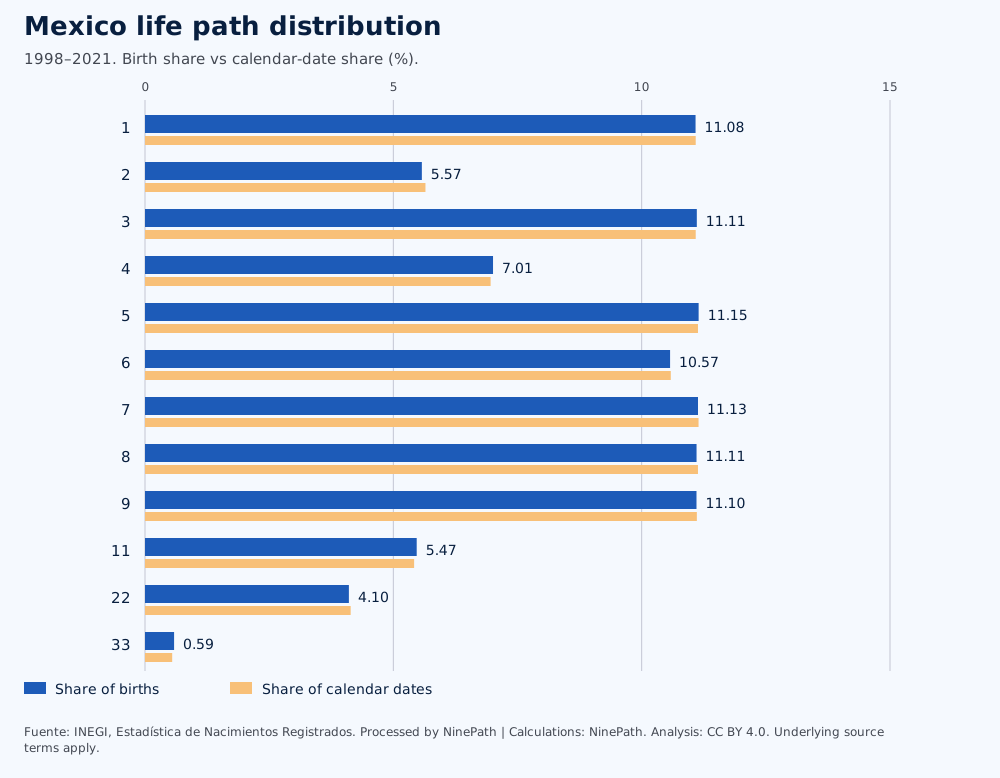
Each chart compares birth shares with the shares of calendar dates in that country’s stated period. Exact checked values are in the download.
Netherlands, 1995–2025
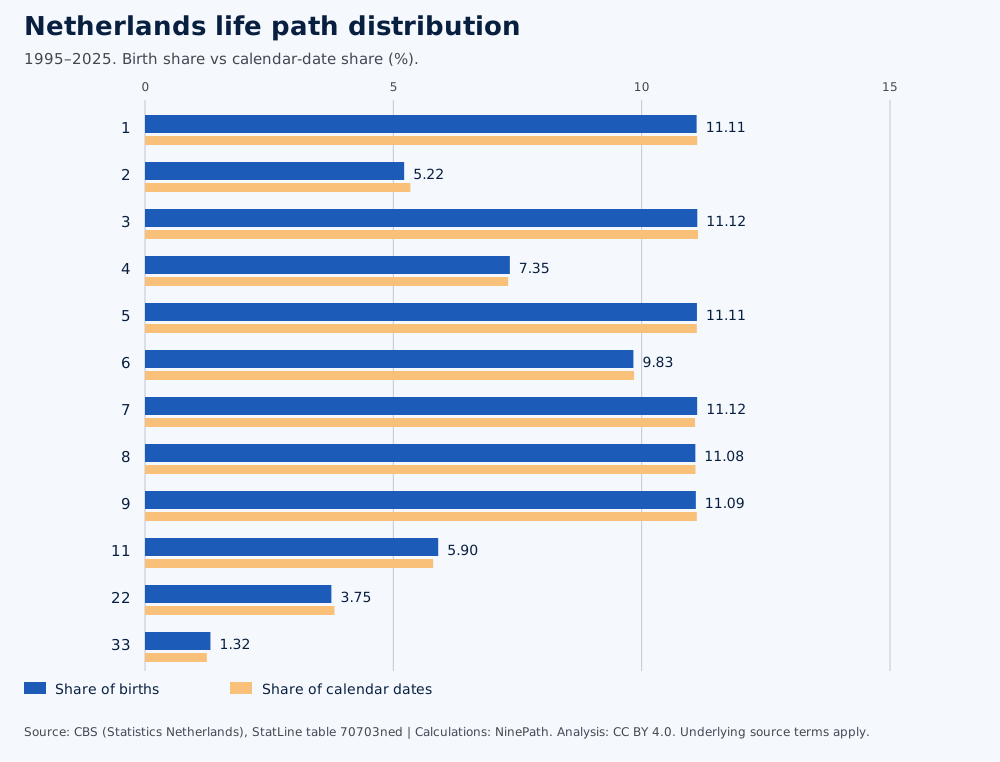
Swipe to see the whole chart
Metropolitan France, 1968–2025
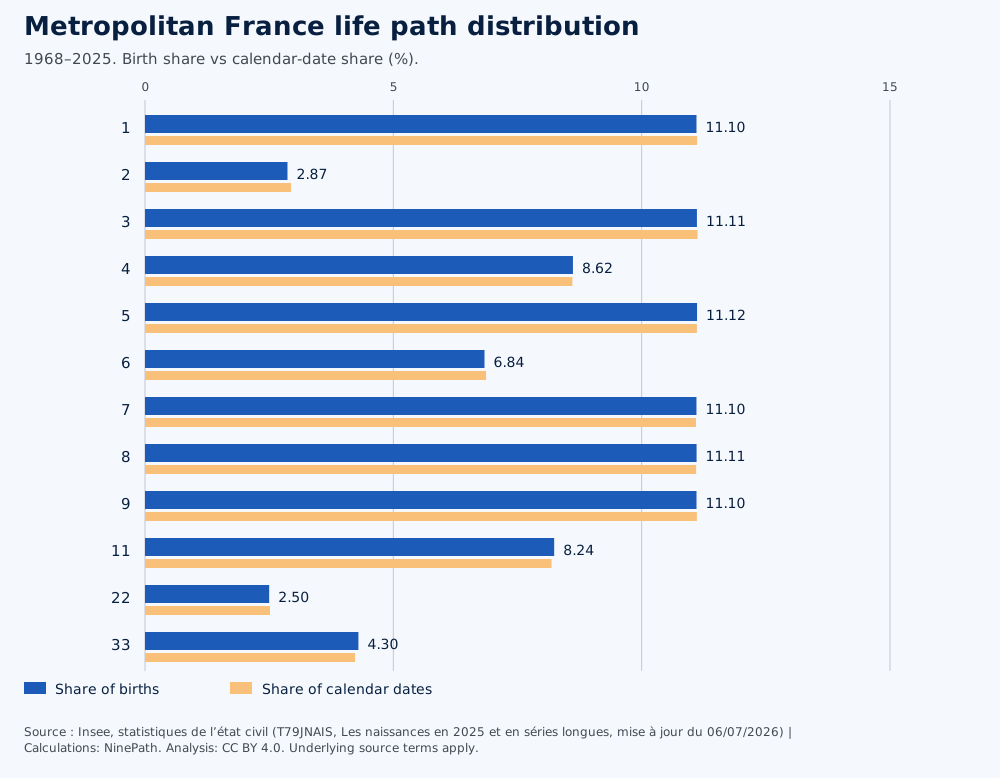
Swipe to see the whole chart
England and Wales, 1995–2025
Swipe to see the whole chart
Denmark, 2007–2025
Swipe to see the whole chart
United States (SSA), 2000–2014
Swipe to see the whole chart
Mexico, 1998–2021
Swipe to see the whole chart
Japan, 1996–2025
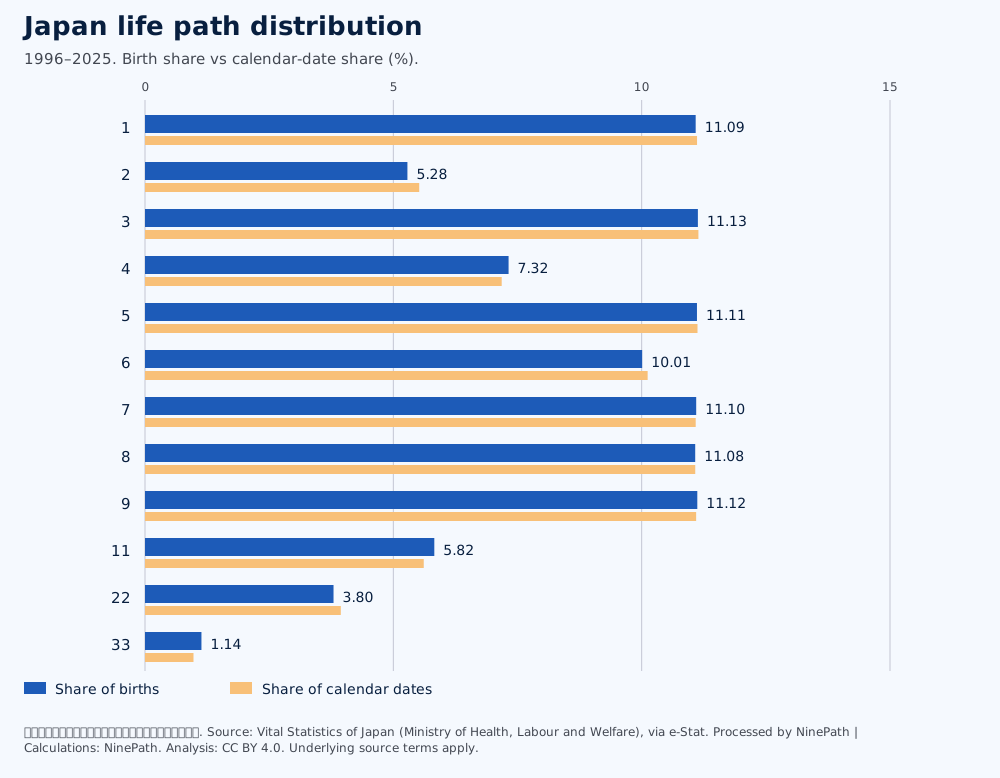
Swipe to see the whole chart
Which calculation did we use?
To find your life path number, add all eight digits of your birth date, then add the digits of the total until one digit is left. If a step lands on 11, 22 or 33, NinePath keeps it as a master number.
The calculation is numerology_v1. A retained master number is not counted again under its single digit. Other reduction rules can give different results. Read how to calculate a life path number for a worked guide or what a life path number is for the basics.
Australia, Canada, Ireland and New Zealand have no year-by-date counts in these sources, so they do not receive life path distributions. Read the source limits and recount method or compare the zodiac sign results.
Questions people ask
What is the rarest life path number?
In the pooled 2007–2014 records, life path 33 is absent. Its absence follows the calendar and this calculation method. It is not a statement about all birth years.
Do countries have naturally different life path distributions?
The country tables cannot establish that. Different birth years change the digit sums. Use the shared-period table for comparisons.
Why keep master numbers in separate rows?
The study follows NinePath’s numerology_v1 method, which keeps the first 11, 22 or 33 reached during reduction. Each birth appears in one displayed-number row.
Sources
- Source: CBS (Statistics Netherlands), StatLine table 70703ned
- Source : Insee, statistiques de l’état civil (T79JNAIS, Les naissances en 2025 et en séries longues, mise à jour du 06/07/2026)
- Source: Office for National Statistics licensed under the Open Government Licence v3.0
- Source: Statistics Denmark. Own calculations based on data from Statistics Denmark, StatBank.dk/foddag
- Source: FiveThirtyEight (CC BY 4.0), from CDC/NCHS (1994–2003) and Social Security Administration (2000–2014) data
- Fuente: INEGI, Estadística de Nacimientos Registrados. Processed by NinePath
- 出典:「人口動態調査」(厚生労働省)を加工して作成. Source: Vital Statistics of Japan (Ministry of Health, Labour and Welfare), via e-Stat. Processed by NinePath
- Source: ABS. Source: Australian Bureau of Statistics, Births, Australia, 2016 (cat. 3301.0), media release 13 December 2017, CC BY 4.0. © Commonwealth of Australia. Accessed 20 October 2026
- Source: CSO Ireland, VSD35 Birth Dates from 1980, CC BY 4.0. Processed by NinePath
- Source: UNdata (United Nations Statistics Division)
- Adapted from Statistics Canada, How common is your birthday?, 1995–2025. This does not constitute an endorsement by Statistics Canada of this product.
- Source: Statistischer Bericht - Geburten 2025, table 12612-20, Statistisches Bundesamt (Destatis), 2026; own calculations.
- Source: Statbel. Processed by NinePath.
- Source: data.gov.my / National Registration Department (JPN), CC BY 4.0. Processed by NinePath.
- Source: SURS. Processed by NinePath.
- This work is based on/includes Stats NZ’s data which are licensed by Stats NZ for reuse under the Creative Commons Attribution 4.0 International licence.